
 | |
| Data as of March 31, 1998 | |
| NASDAQ:XLNX
12-Month Price Range: $29 11/16 - $57 1/2 Avg Daily Trading Volume (12-Mth) : 2.4M Shares Outstanding: 73.0M Market Capitalization: $2.7B Price/Earnings (Trailing 12-Mth): 24x |
Number of Patents: 206
Proprietary % of Revenue: 95% Institutional Ownership: 80% Number of Employees: 1393 Business: Programmable Logic Devices and Design Software |
|
COMPANY & PROGRAMMABLE LOGIC OVERVIEW (cont.) |
||
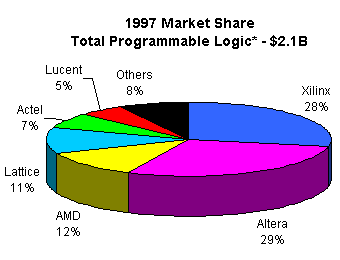
Source: In-stat April 1998 *Does not include software, hardwire or support EPROMs |
||
|
|
||
 |
 |
|
| ABN AMRO Chicago Corp.
Adams, Harkness & Hill AG Edwards BancAmerica Robertson Stephens BT Alex Brown Bear Stearns & Co. CIBC Oppenheimer Cowen & Company CS First Boston Deutsche Morgan Grenfell Donaldson Lufkin & Jenrette |
Hambrecht & Quist
J.P. Morgan Lehman Brothers Merrill Lynch Morgan Stanley Dean Witter NationsBanc Montgomery Securities Prudential Securities SBC Warburg Dillon Read Soundview Financial Volpe Brown Whelan & Co. |
| Valuation Ratios | Mar-98 | Dec-97 | Sep-97 | Jun-97 |
|
| Annualized ROE | 23% | 22% | 22% |
|
|
| Annualized ROA | 13% | 13% | 13% |
|
|
| Current Ratio | 4.8 | 5.3 | 5.6 |
|
|
| Quick Ratio | 4.3 | 4.8 | 5.1 |
|
|
| Cash/Share ($) | 4.64 | 5.27 | 5.34 |
|
|
| Book Val/Shr ($) | 7.05 | 7.37 | 6.90 |
|
|
| Inventory days (quarter ending) | 86 | 88 | 87 |
|
|
| Days sales outstanding | 36 | 39 | 40 |
|
|
| 12-mo avg revenue per employee ($K) | 451 | 460 | 457 |
|
|
| Financial Highlights | For the years ended March 31 | ||||
| 1998 |
|
|
|
|
|
| Income Statement ($M) | |||||
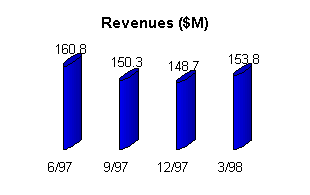
| Net revenues | $613.6 |
|
|
|
|
| Gross margin | 62% | 62% | 64% | 61% | 61% |
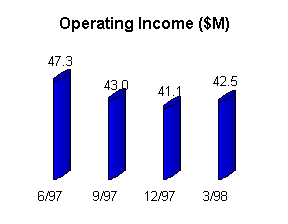
| Operating income | 173.9 | 159.1 | 165.8 | 92.0 | 65.2 |
| Operating margin | 28% | 28% | 30% | 26% | 25% |
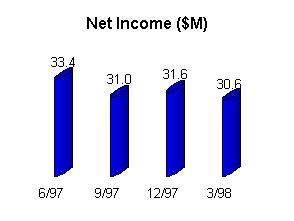
| Net income | $126.6 |
|
|
|
|
| Profit margin | 21% | 19% | 18% | 17% | 16% |
| Diluted EPS ($) | $1.58 |
|
|
|
|
| Diluted shares outstanding (M) | 80.0 | 79.7 | 79.0 | 74.1 | 72.2 |
| Balance Sheet ($M) | |||||
| Working capital | 474.6 |
|
|
|
|
| Total Assets | 941.2 |
|
|
|
|
| Long-term obligations | 250.0 |
|
|
|
|
| Stockholders' equity | 550.2 |
|
|
|
|
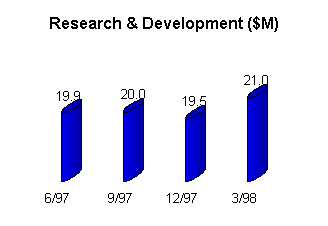
| Financial Highlights (cont.) | |
 |
 |
 |
 |
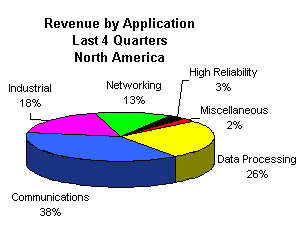
| Communications | Data Processing | Industrial | Networking | High Reliability |
| Lucent Technologies
Northern Telecom Ericsson |
Sun Microsystems
IBM EMC |
Hewlett-Packard
Kodak NEC |
Cisco
3COM Bay Networks |
Boeing
Lockheed Martin Northrop Grumman |
| Communications | Data Processing | Industrial | Networking | High Reliability |
| Cellular Base Stations
Central Office Switches |
Computer Peripherals
Mass Storage |
Instrumentation
Medical Equipment |
ATM
Switches
Routers |
Commercial Aviation
Satellite Communication |