 | |

|
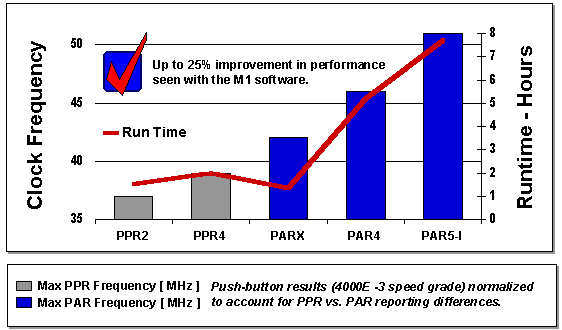
Performance Improvements. This graph represents the results received by running the PPR and par tools on a suite of over 750 end user designs on the 4000E-B grade parts. As you can see the gray bars represent the maximum frequency received by PPR and the blue bars represent the maximum frequency delivered by PAR. These were in default and push button modes. PPR effort level two and four delivered much lower clock frequencies than the subsequent versions of PAR. PAR delivered an average of up to 25% improvement in performance on this suite of designs. It is important to point out that this is strictly a comparison of algorithmic strengths, as the 4000E architecture is used with both systems. As more CPU cycles are leveraged, the PAR 4 and PAR 5 switches continually deliver increased performance. |