 | |

|
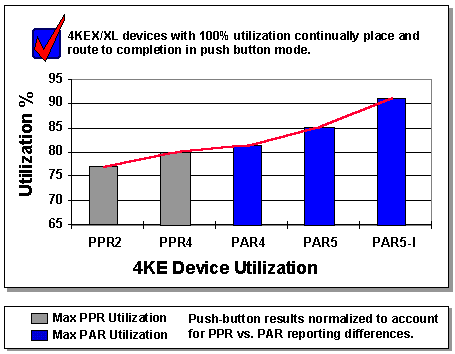
To compare device utilization we used the same suite of over 750 user designs and once again compared the performance of ppr to that of par. This graph shows the average utilization percentage of the same suite of 4KE designs. As you can see, the par tools delivered, on average about 10% increase in utilization on this same suite of designs. Itís important to note; with the 4KE and XL devices we continually see designs that are 100% utilized, placed and routed to spec, in push button mode. |