B.3. The DOM Inspector
The DOM Inspector tool, which is now installed by default in the Mozilla browser and accessible from Tools > Web Development, displays the document object mode of any document or part of the interface and allows you to update that DOM dynamically by changing attribute values, rearranging the structured content, or deleting nodes.
 | The DOM Inspector reads the DOM of the requested window or document into memory, where you can manipulate it. However, the DOM Inspector does not persist your changes back out to the file from which that DOM was originally loaded. |
If you use JavaScript in the interface or to manipulate web pages, then you will recognize what a powerful tool it can be -- particularly given how hard it can be to see the interface's object model clearly and figure out which nodes in the DOM correspond to which parts of the displayed interface. The DOM Inspector also allows you to inspect local files and URLs.
To open a file for inspection in the DOM Inspector, choose either File > Inspect a Window or Inspect a URL . . . and enter the URL of the web document you want to inspect in the dialog. When the DOM Inspector loads a document, it displays the DOM (as shown in Figure B-1 of that document) as a tree structure on the lefthand side and the individual nodes with their attributes and other information on the righthand side.
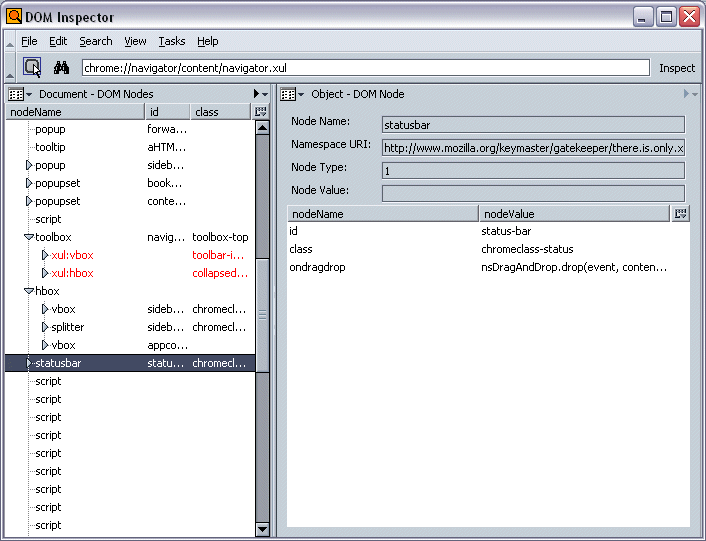
As you click on the nodes in the tree in the left panel, the DOM Inspector highlights the nodes that are part of the visible interface by pointing them out with a blinking red border. You can peck through the tree in the DOM Inspector and find all parts of the interface.
The DOM Inspector also displays any anonymous content that is part of the window. See Chapter 7 for information about anonymous content and the way it relates to the DOM. The anonymous content nodes that are bound to the window you specify become part of the DOM that the Inspector reads and can be analyzed and manipulated like any other node.
The pull-down widgets to the left of the pane headers let you select which portions of the DOM are displayed in the panels. By default, the DOM nodes are displayed, as shown in Figure B-1, but you can also display the associated stylesheets, the JavaScript objects, the XBL bindings, the document's box model, and other information.