
The software we will be using today, the Borland Turbo Debugger, is very old technology (circa 1988), but it does work. More importantly, it offers the newcomer to the 80x86 architecture and its associated assembly language programming an inside look at the 80x86 processor. It runs from DOS, so if your computer is not running in DOS mode, restart windows in DOS mode now or select "Command Prompt" from the Accessories menu.
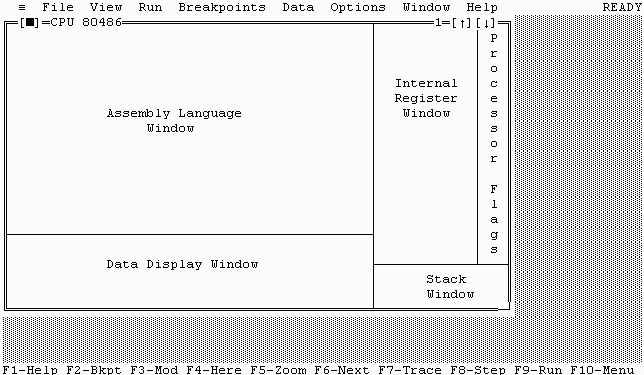
Once you get to the command prompt screen, all commands will be entered with text strings. Turbo Debugger (TD) is located in the directory C:\TD on your machines. Change to this directory now by first verifying that you are in the C-drive (type C: and return if you are not), then using the DOS command CD\TD. Your command prompt should now look like C:\TD>. Start the debugger by typing the command TD. Once you've started TD, you should see a screen similar to the one shown in the figure below.
This opening screen allows the user to view:
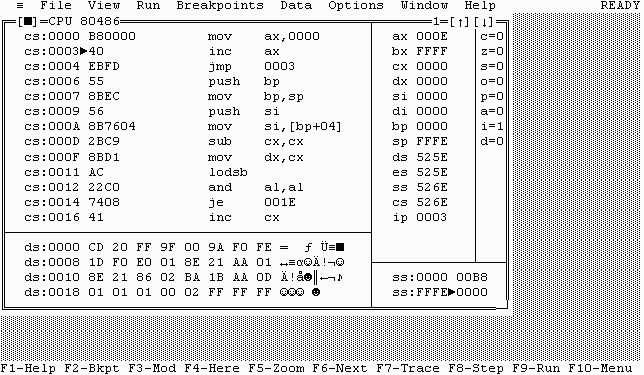
The purpose of this lab is to reinforce what we learned during the introduction to microprocessors lecture by running some code in the Turbo Debugger and seeing how the code affects the registers and other microprocessor components. First, let's examine the Turbo Debugger screen. The figure below labels the components of the screen.
Internal Register Window - Let's start with a simple window. The internal register window displays the current values stored in the registers of the microprocessor. Remember, a register is simply a group of latches that when combined store a single value. The code that executes on the processor may use these registers to remember data or address locations. Below is a list of the registers along with their description. Don't worry if the description doesn't help much; just note that each has a different purpose.
Each of the data registers (AX, BX, CX, and DX) can also be referred to by their low byte or their high byte. This simply means that instead of grouping 16 latches together as a single number, they can also be referenced as two groups of 8 latches. For example, if you want to modify only the low byte of the register AX, you refer to it as AL. This will cause the processor only to alter the lower eight bits. These "sub registers" are labeled as:
| AH -> high half (byte) of AX | AL -> low half (byte) of AX |
| BH -> high half (byte) of BX | BL -> low half (byte) of BX |
| CH -> high half (byte) of CX | CL -> low half (byte) of CX |
| DH -> high half (byte) of DX | DL -> low half (byte) of DX |
The remaining registers are pointer registers:
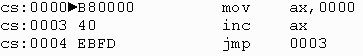
Assembly Language Window - This window displays to the user information about the code that will be executed. Each line looks something like the following:
cs:000A 8B7604 mov si,[bp+04]
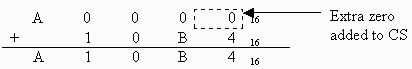
The cs indicates that the CS (code segment) register contains the segment where the code is stored. Take the value in CS, shift it left 4 bits (i.e., tag four binary zeros or one hexadecimal zero to the right side of the number), then add the hexadecimal number to the right of the colon to the shifted CS value. This is the physical address of the line of code. For example, if CS = A00016, then CS:10B4 indicates that the physical address that the line of code is stored in is A10B416.
The user can also determine the next address to be executed from this window.
The instruction with the ![]() after the address is the next address to be executed. You can also determine
this by adding the value in the register IP to CS using the technique above.
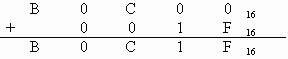
For example, if CS=B0C016 and IP=001F16, then the next
address to execute would be CS:IP.
after the address is the next address to be executed. You can also determine
this by adding the value in the register IP to CS using the technique above.
For example, if CS=B0C016 and IP=001F16, then the next
address to execute would be CS:IP.
The hexadecimal number following the address (8B7604 in the case of our example above) represents the actual binary data that is stored in memory to represent the instruction. In other words, this is the machine code that our assembly language translates to. For those of you who want the specifics, 8B76 means move the value pointed to by the base pointer (BP) along with some offset into the source index (SI) register. The 04 that follows is the offset. This gives us the instruction mov si,[bp+04].
After the hexadecimal instruction value, there is the text representation of the instruction. This text is the assembly language code that the processor will execute.
Data Display Window - This window displays the hexadecimal values of the memory array where the data segment register (DS) is pointing. This is where the program will get its data. Notice once again the use of the segmented addressing with DS as the segment.
Processor Flags - As we discussed last class period, there are bits that are set or cleared in order to indicate the result of a process or to indicate the current state of the processor. As an example, the purpose of three of those bits is shown below.
Note that if you do not have mouse control, you can move between windows on the TD screen using the tab key. Use the arrow keys to go between items within a single window.
Throughout this lab, you will be asked to change the values in some of the registers. Use the following techniques to do this.
Ctrl: I-Increment D-Decrement Z-Zero C-Change R-Registers
We also have access to the processor's flags. The next few steps will show you how they are affected.
We're done! To quit Turbo Debugger, press ALT-F to open the file menu and Q to quit.
Developed by David Tarnoff for the Spring 2003 sections of CSCI 2150 at ETSU