


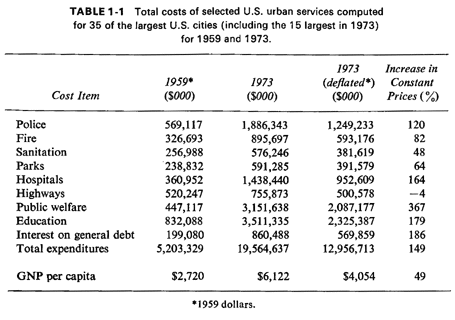
1.1 COST EFFECTIVENESS OF URBAN OPERATIONS RESEARCH STUDIESThe potential benefits of an urban operations research study can be appreciated better once one becomes aware of both the magnitude of current expenditures for urban services and the rate at which these expenditures have been increasing in recent years. Table 1-1 shows the cost of various services for 35 of the largest cities in the United States (including the 15 largest ones) for the years 1959 and 1973 [ODON 77].3 After deflating the 1973 figures to 1959 prices (the total nationwide inflation between 1959 and 1973 was 51 percent), the last column of Table 1-1 presents the percentage increases [in constant (1959) dollars]. The increase in per capita gross national product (GNP) during the same period (in 1959 dollars) amounted to 49 percent, or one-third of the percentage increase in total city expenditures. This growth in total expenditures cannot be attributed to large population increases, since the total population of the 35 cities covered by Table 1-1 increased by less than 2 percent between 1959 and 1973. As seen from the table, only expenses for highways lagged behind the rate of growth of the national economy (as reflected in GNP per capita), while expenses for sanitation departments just kept pace with that growth. Costs of most other urban services over the past generation have increased two, three, or more times as rapidly as have costs in other sectors of the economy. The absolute expenditures are impressive in themselves. New York City now spends more than $2 billion a year for police, fire protection, and sanitation alone. This amount exceeds the annual budgets of many national governments in the world. It is also interesting that one of the fastest-growing items in Table I -I is the interest that city governments pay annually to service their debts. Probably more pertinent to the type of issues that we shall be addressing are unit costs, such as average salaries. The average salary (with no overtime pay) for a policeman or a fireman in large U.S. cities in 1979 was about $19,000. In addition, fringe benefits (such as health insurance, retirement plans, etc.), and overtime pay cost cities another 40 percent (approximately) of that amount [ODON 77]. Thus, the average cost per rank-and-file police department or fire department employee to the city was about $27,000 per year.
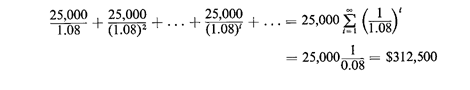
corresponding to $270,000 per year! The fact that the patrol car itself, the equipment it includes, and the fuel it consumes probably cost less than $10,000 per year also serves to illustrate how labor-intensive the police patrol car service is. Indeed, it has been found that in large police departments in the United States, labor-related costs have consistently amounted to about 90 percent of annual department costs over the past 20 years [ODON 77]. To make costs even higher, some police and fire departments now have two approximately equal-sized labor pools: one active and one retired, the latter costing about as much per year as the former. These facts immediately present the urban operations research analyst with a challenge. Small gains in productivity (even of the order of I to 2 percent) can mean large savings to a city in monetary terms. Analyses such as those that will be described in this book have the potential for being very cost-effective. There are two very simple ways in which we can evaluate the cost effectiveness of a study. The first applies when the study results in a net decrease in costs, assuming that service quality remains unchanged. Then the benefit/cost ratio of the study is the ratio of the present discounted value of savings achieved by implementing the study to the cost of the study. For instance, if a study costing $50,000 results in a cost savings of $25,000 per year projected indefinitely-then at a discount rate of 8 percent, the present value of the savings achieved is
 The second method for evaluating the cost effectiveness of a study applies when there is no net decrease in costs, but service quality is improved. This is more difficult to carry out in practice because of the problems involved in measuring service quality for most urban services. Still, suppose that according to several accepted measures of service quality, we can make a statement such as the following: "Implementing the results of the study improved service quality by an amount that would have required N additional personnel under the former operating procedures." Then the present discounted cost of the N additional personnel, who are now not needed, can be used to compute the benefit/cost ratio of the study.
What is surprising about most such computations is the small percentage
in service improvement or cost reduction that is needed to make most
studies cost-effective. As argued in Chapter 8, this line of thinking
is not currently popular in cities because rarely can one decrease costs
outright, and performance measures to gauge service quality are often
found difficult to state explicitly. Still, any reasonable approximate
measure of service quality improvement will often yield a value of 5 or
more as the anticipated benefit/ cost ratio of a study. |