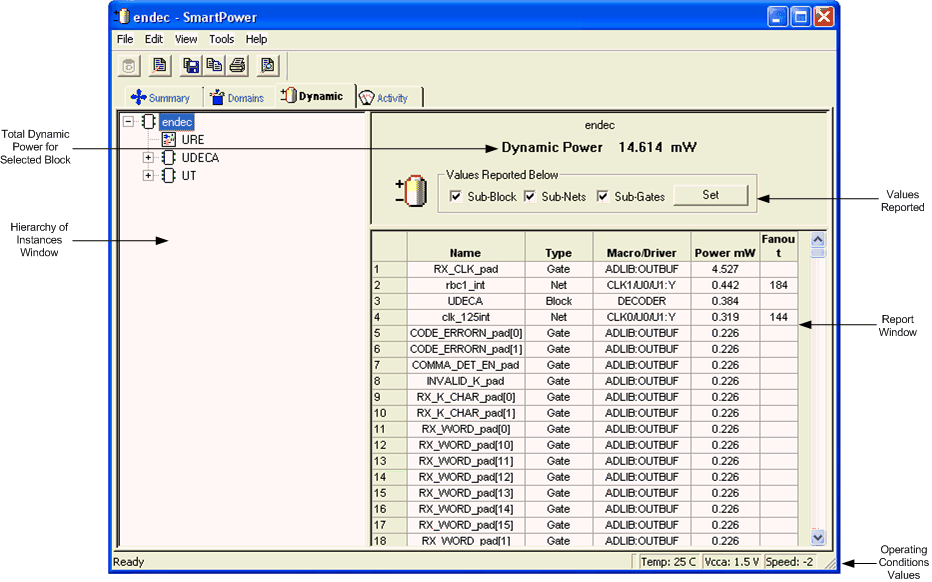
The Dynamic tab enables you to inspect detailed hierarchical reports of the dynamic power consumption. The Dynamic tab consists of two windows: the Hierarchy of Instances window, and the report window.

SmartPower Dynamic Tab
SmartPower displays the hierarchy of instances in a list in the hierarchy window. Sub-blocks of a block are shown in the tree when you click the plus sign (+) next to the block. Only hierarchical blocks are displayed in this list (no gates or nets).
When you select a block of the hierarchical tree, SmartPower displays its name and its dynamic power consumption in the report window.
SmartPower displays the list of sub-elements of the selected block in the Report window. By default, this list includes all sub-elements. The dynamic power consumption of each sub-element is displayed with useful information like the fanout and the driver name for a net, or the macro model name for a gate. The tool computes the power of a net on a flattened netlist and reports the result on the user hierarchical netlist on the sub-net connected to the driver.
You may limit the list of sub-elements to a list of sub-blocks, or gates, or nets, or any combination of these three classes of sub-elements. You may also sort the list according to different criteria (double-click a column label to sort the list based on this column, or change the sort-order).
You can export (to a text file) and print the grid that details your designís power consumption. To do so, select the elements of the grid that you wish to export or print, and then from the File menu select Export Grid or Print Grid, respectively.