Menu Bar
Click each menu bar item to see its pull-down menu.
Open button
Print button
Click to print one copy of the current plot window.
Cut button
Click to cut the currently selected item.
Copy button
Click to copy the currently selected item.
Paste button
Click to paste the currently copied or cut item.
Zoom buttons
Click to zoom the displayed view in or out.
View Area button
Click to zoom in to the selected area.
View Fit button
Click to zoom out so that all the data is visible in the selected plot.
X Scale button
Click to toggle the X axis between log and linear scaling.
Fourier Transform button
Click to display the Fourier Transform of all traces in the selected plot.
Performance Analysis button
Click to enter Performance Analysis.
Y Scale button
Click to toggle the Y axis between log and linear scaling.
Add Trace button
Eval Measurement Function button
Click to evaluate the measurement function or expression of measurement functions on data from one PSpice run.
Text button
Click to type text to place on the displayed plot.
Display Cursor button
Click to turn the data cursor on or off.
Peak button
Click to move the cursor to the next peak.
Trough button
Click to move the cursor to the next trough.
Slope button
Click to move the cursor to the next point of maximum slope.
Min button
Click to move the cursor to the minimum Y value.
Max button
Click to move the cursor to the maximum Y value.
Point button
Click to move the cursor to the next data point.
Search button
Click to display the Search dialog box.
Next Transition button
Click to move the cursor to the next digital transition.
Previous Transition button
Click to move the cursor to the previous digital transition.
Mark Data Points button
Click to view data points on the plot.
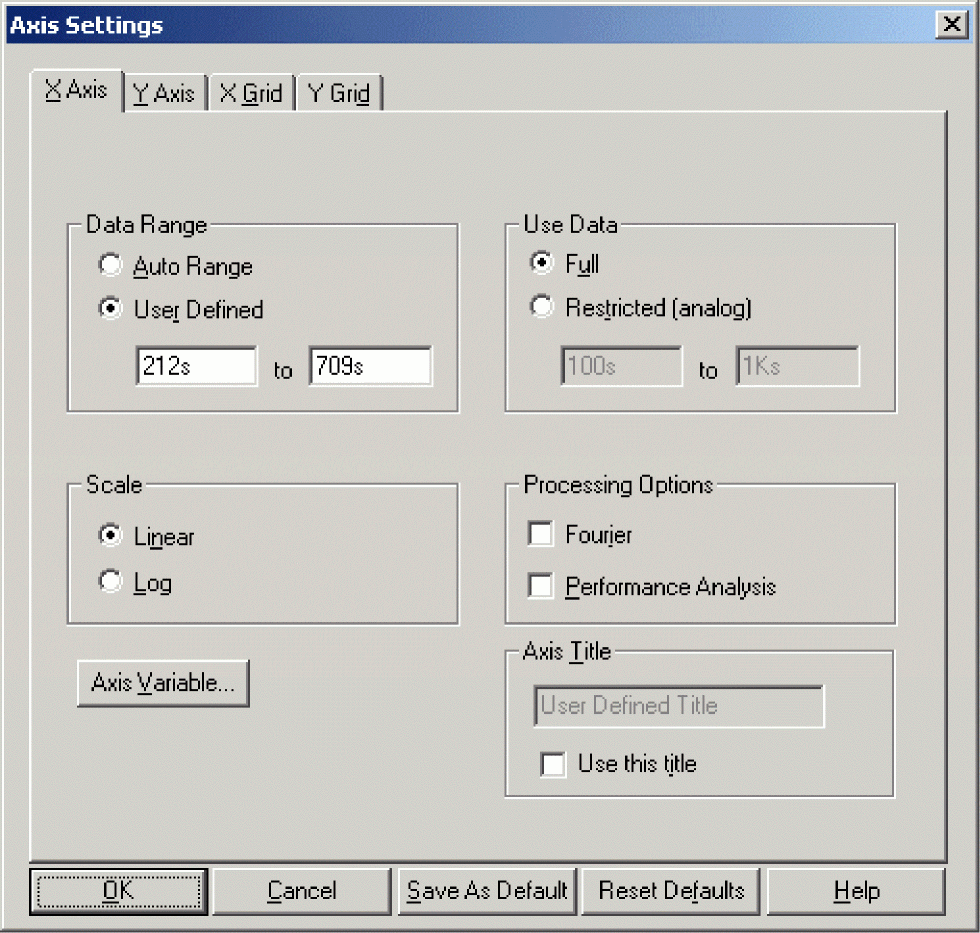
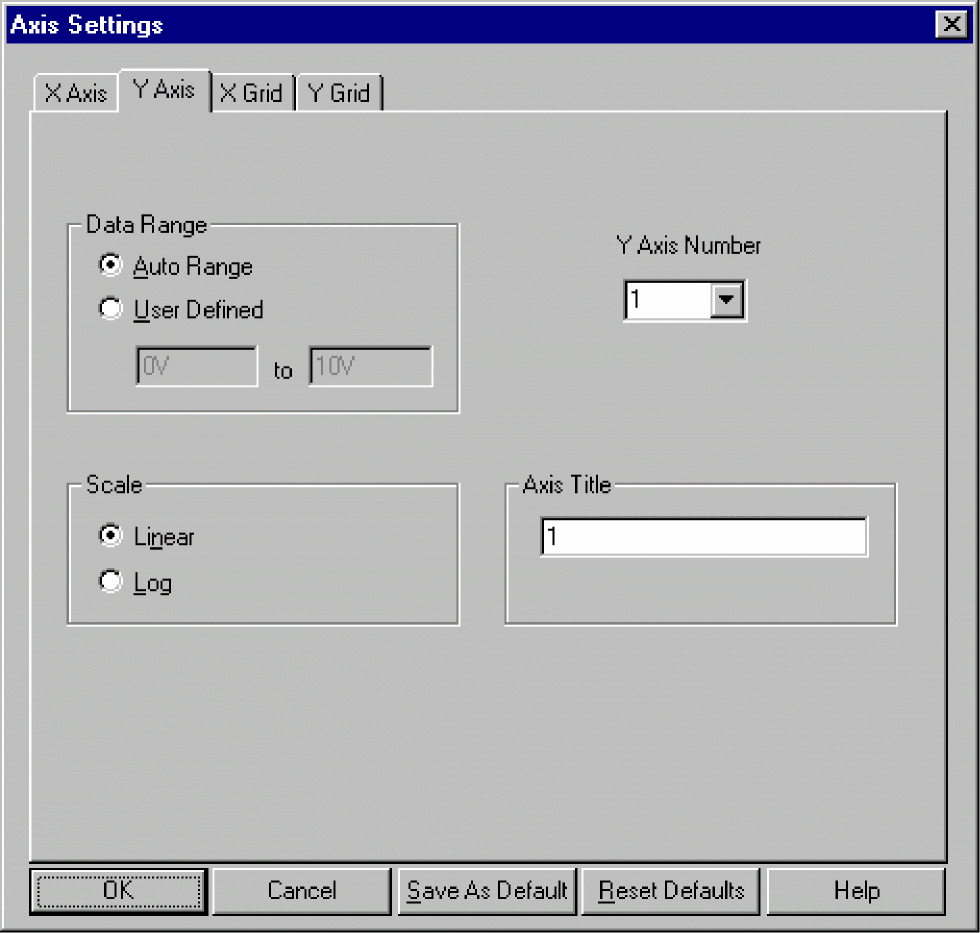
X Axis Data Range
Click Auto Range to let Probe set the range, or click User Defined and type a specific data range to display.
Processing Options
Click to select either Fourier Transform or Performance Analysis:
Variable
Click to display the Axis Variable dialog box.
Text Area
The definition of the measurement function is shown here.
This Measurement Function is Saved in the File
The location of the measurement function on your system.
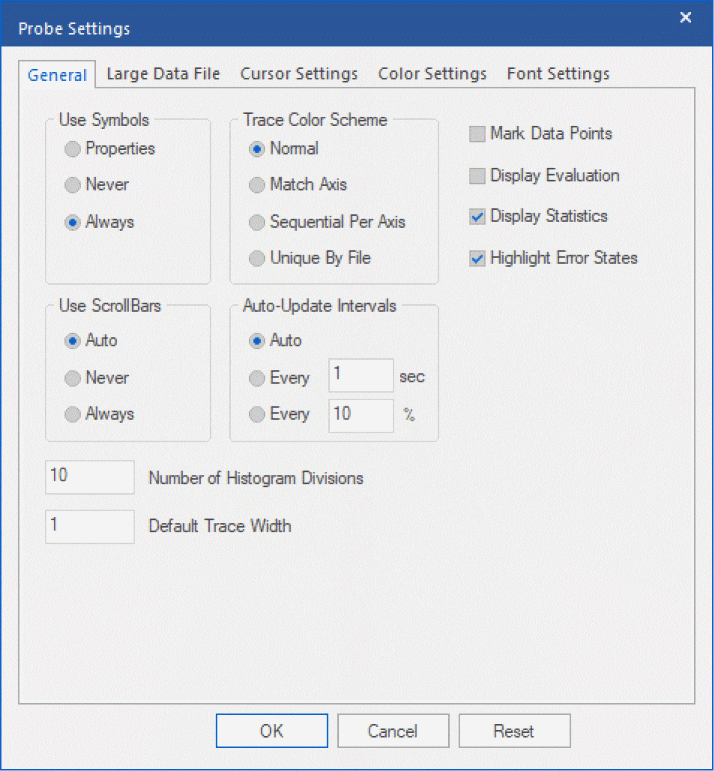
Use Symbols
Click to select when and how Probe uses symbols when displaying traces.
Use Scroll Bars
Click to set scroll bar usage.
Trace Color Scheme
Click to set how Probe uses color to display traces.
Highlight Error States
Select to enable automatic highlighting of error states when digital traces are displayed.
Number of Histogram Divisions
Type the number of histogram divisions to be used when Probe displays a Performance Analysis result from a Monte Carlo simulation.
Number of Cursor Digits
Type the number of digits Probe will display when the cursor position is shown.
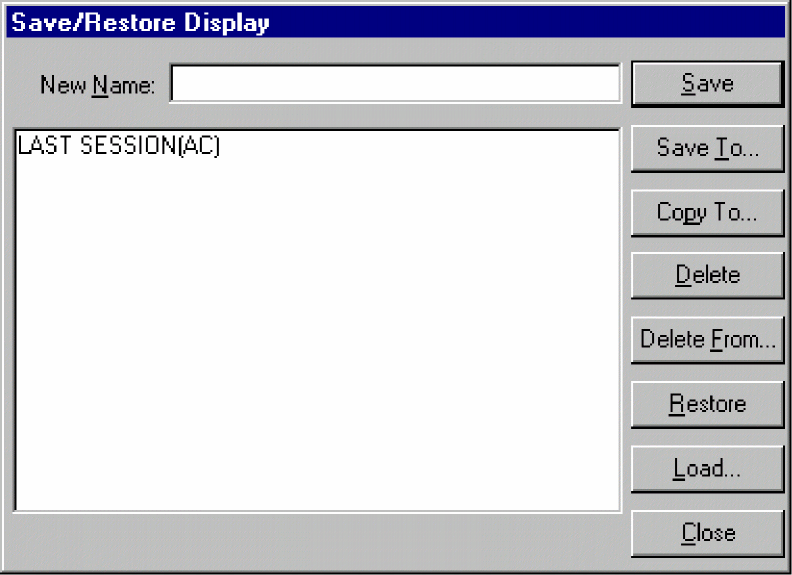
New Name
Type a name to save this display as.
List
Click to select one of the available displays shown here.
Save
Click to save the display with the assigned name.
Save To
Click to save the display to a specific place.
Copy To
Click to copy the selected display.
Delete
Click to delete the selected display.
You can only delete local displays using the Delete button. To delete a display from a remote or global .PRB file, click Delete From.
Delete From
Click to delete a display from a remote or global .PRB file.
Restore
Click to use the selected display.
Load
Click to load another file with displays.
Close
Click to close the Save/Restore dialog box.
Box
Type the search command in this box.
Cursor To Move
Click to select the cursor to search.
List
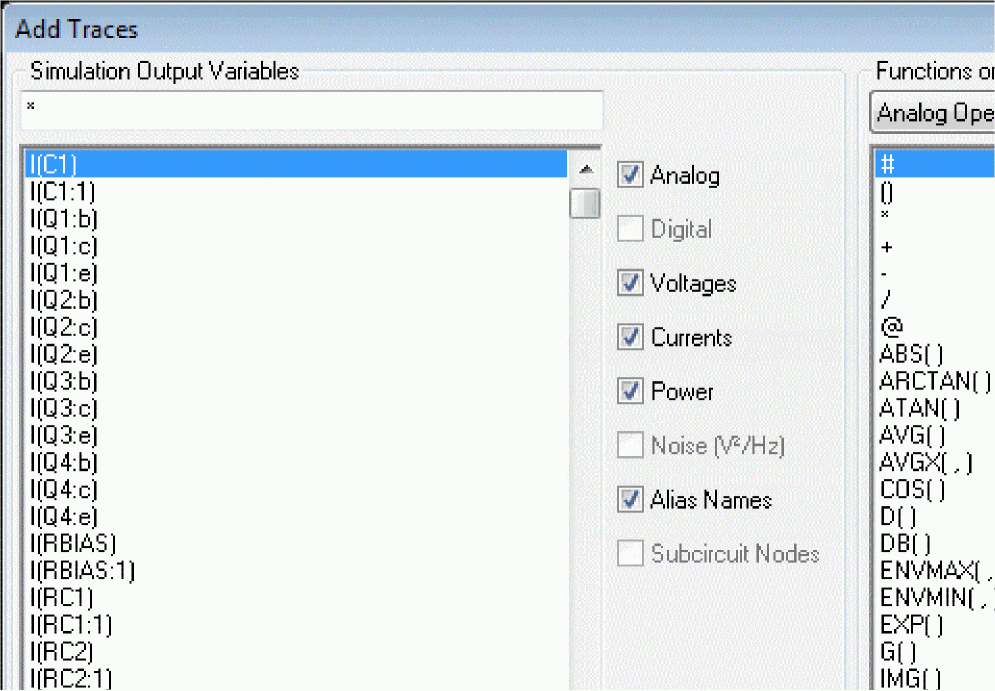
Click to select one of the available traces and measurement functions listed here.
Analog
Click to select whether analog node names are listed.
Digital
Click to select whether digital node names are listed.
Voltages
Click to select whether voltage node names are listed.
Currents
Click to select whether current node names are listed.
Alias Names
Click to select whether alias node names are listed.
Internal Subcircuit Nodes
Click to select whether Internal Subcircuit Nodes names are listed.
Measurement Functions
Click to select whether measurement functions are listed.
Trace Command
Type the command or expression to use with the selected trace or measurement function.
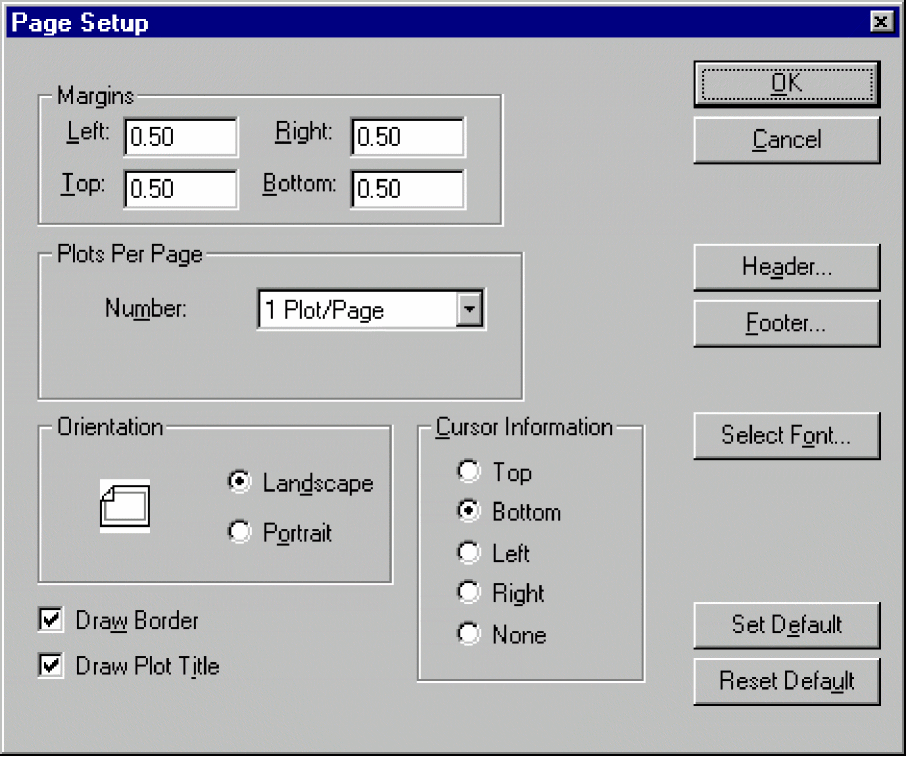
Margins
Type the margins in inches in the text boxes.
Plots Per Page
Click to select the number of plots to print on each page.
Orientation
Click to select the orientation of the page.
Cursor Information
Click to select where the cursor information is printed.
Draw Border
Click to select whether a border is used when the trace is printed.
Draw Plot Title
Click to select whether the plot title is printed on the page.
Header
Click to display the Header dialog box.
Footer
Click to display the Footer dialog box.
Printer Setup
Click to display the Printer Setup dialog box.
Printer Select
Click to display the Printer Select dialog box.
Set Default
Click to set the current settings as the default settings.
Reset Default
Click to reset the current settings to the default settings.
New Measurement Function Name
Type the name of the new measurement function.
File to Keep Measurement Function In
Click to select the location of the saved measurement function.
Box
Type the name of the window title.
Definition
Type the name and definition of the macro.
List
The available macros and the definitions are listed here.
Save
Click to save the current macro and definition.
Save To
Click to save the current macro and definition to a specific location on your system.
Delete
Click to delete the current macro and definition.
You can only delete local macros using the Delete button. To delete a macro from a remote or global .PRB file, click Delete From.
Delete From
Click to delete a macro and definition from remote or global .PRB file.
Load
Click to load another file with macros and definitions.
Close
Click to close the Macros dialog box.
Left Side
Type the text for the left side of the header.
Center
Type the text for the center of the header.
Right Side
Type the text for the right side of the header.
OK
Click to use the current header definitions and close the Header dialog box.
Cancel
Click to close the window and abandon your changes.
Set Default
Click to set the current header settings as the default.
Reset Default
Click to reset the header to the default settings.
Date Run button
Click to insert the date in the selected header area.
Header Date & Time button
Click to insert the date and time in the selected header area.
Header Time Run button
Click to insert the time the trace was run in the selected header area.
Header Temperature button
Click to insert the temperature information in the selected header area.
Left Side
Type the text for the left side of the footer.
Center
Type the text for the center of the footer.
Right Side
Type the text for the right side of the footer.
OK
Click to use the current footer settings and close the Footer dialog box.
Cancel
Click to close the window and abandon your changes.
Set Default
Click to set the current footer settings as the default.
Reset Default
Click to reset the footer to the default settings.
Date Run button
Click to insert the time the trace was run in the selected footer area.
Date & Time button
Click to insert the date and time in the selected header area.
Time Run button
Click to insert the time the trace was run in the selected header area.
Temperature button
Click to insert the temperature information in the selected header area.
List
The available measurement functions are listed.
New
Click to create a new measurement function.
Copy
Click to copy a measurement function.
View
Click to view a measurement function definition.
Edit
Click to edit an existing measurement function.
Delete
Click to delete the selected measurement function.
Eval
Click to evaluate the selected measurement function.
Load
Click to load another file with measurement function definitions.
Page Setup dialog box
Add Trace dialog box
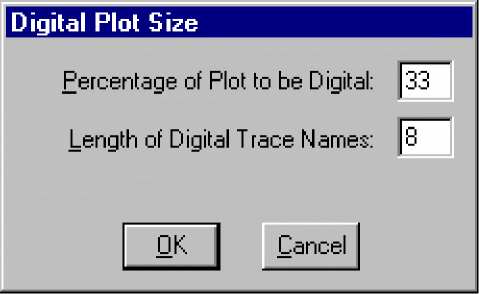
Digital Size dialog box
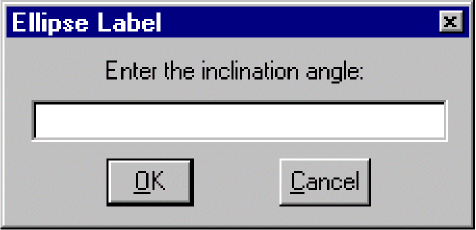
Ellipse dialog box
X Axis tab
Display Control dialog box
Open File button
Zoom In button
Zoom Out button
Cursor button
Copy button
Text button
Paste button
Cut button
Fit button
Peak button
Trough button
Slope button
Point button
Min button
Max button
Next Transition button
Previous Transition button
Add Trace button
Probe Settings dialog box
Y Axis tab
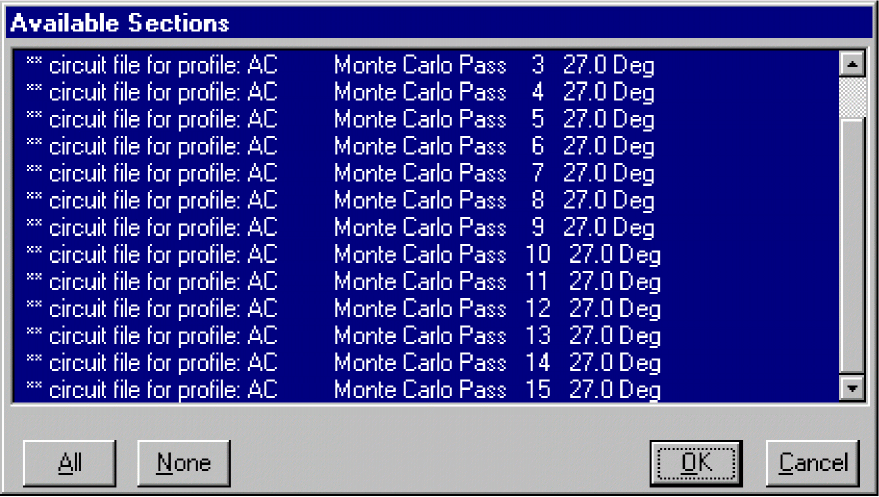
Available Sections dialog box
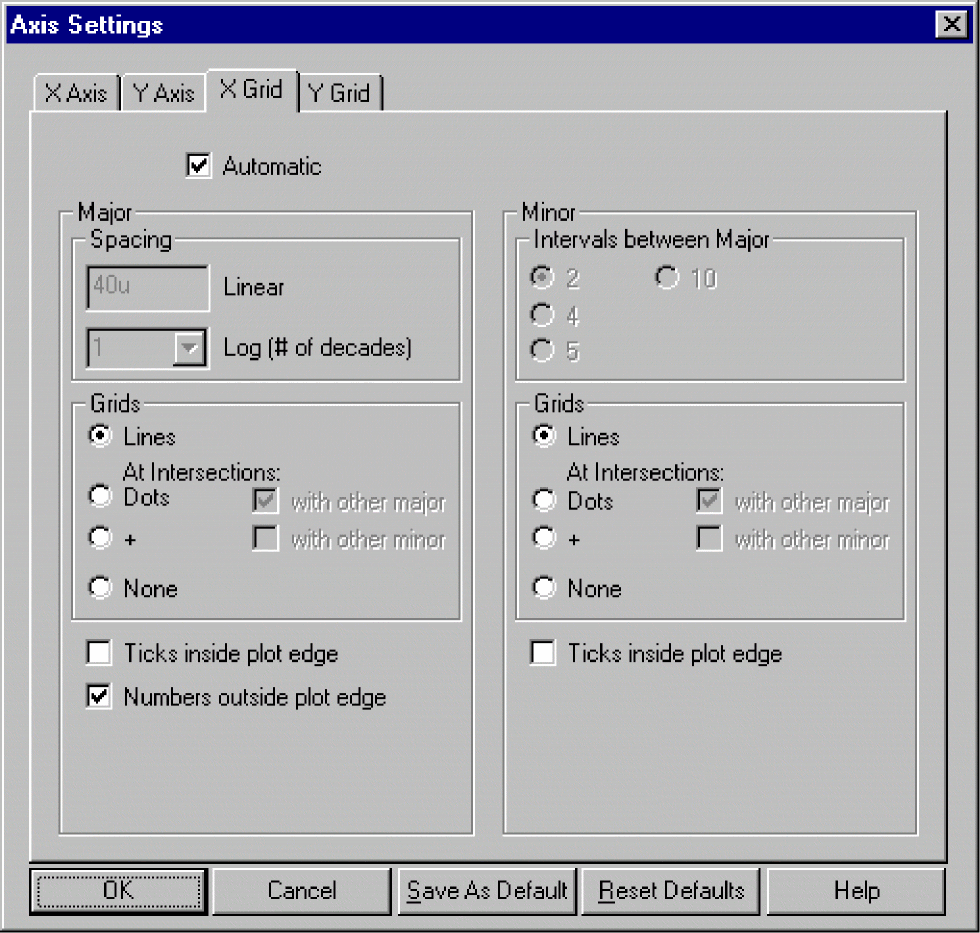
X Grid tab
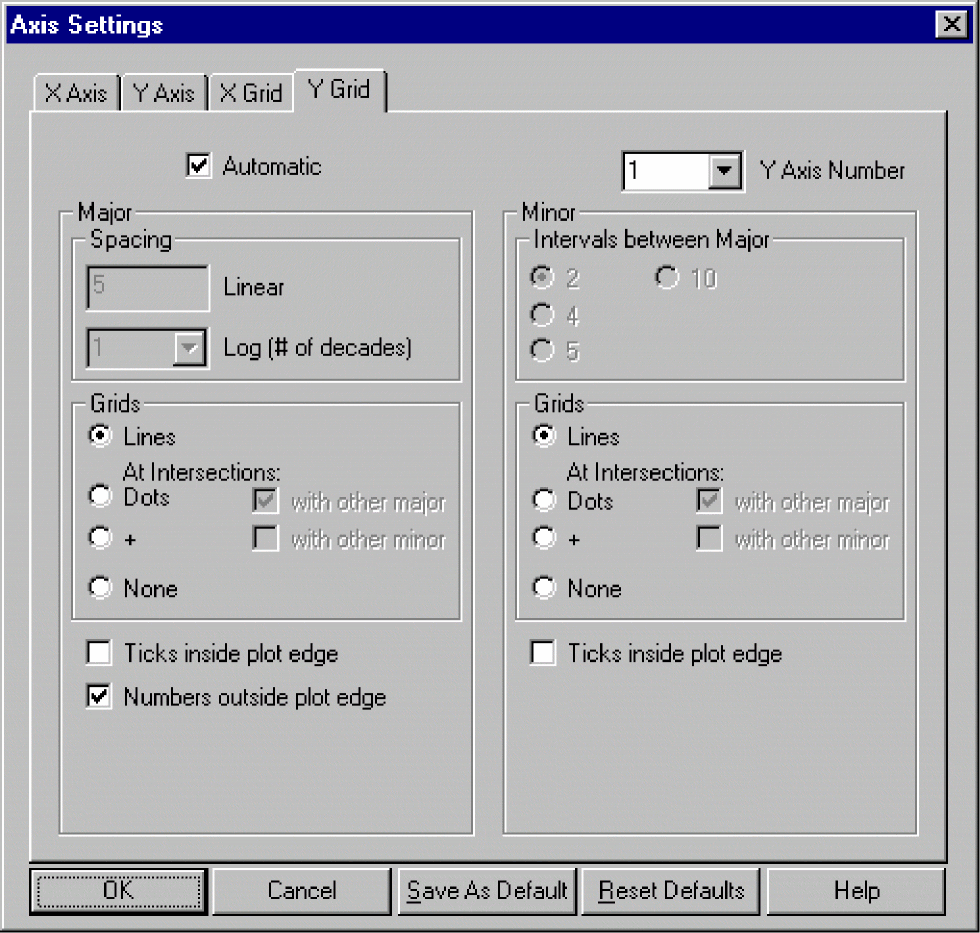
Y Grid tab
Return to top