 | |

|
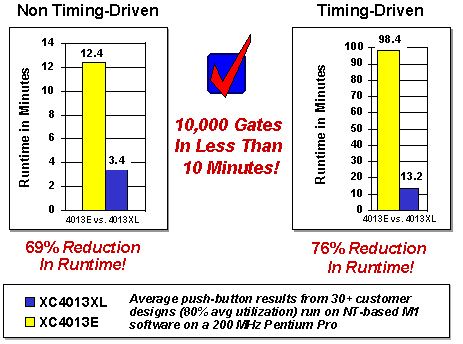
The second aspect of performance is run time improvements. In these graphs we see the comparison of the existing 4013E devices compared to the new 4013XL devices, which were modeled using our device modeling capabilities. They represent the second release of software optimized for software. For this suite of designs, we’ve used average push button results from over 30 customer designs, averaging over 80% utilization, run on the NTbased M1 software on a Pentium pro. The left graph shows the average time of those 30 designs run in non-timing driven mode. And you can see that the 4013E’s ran in an average of 12.4 minutes. The 4013XL’s ran in under 4 minutes, which represents an average reduction of over 69% in run time. In the right graph you can see that in timing driven mode, the 4013E’s took nearly 100 minutes on average to route, where the 4013XL’s routed in 13 minutes, a 76% reduction in run time. The tests are reproducible, and the data speaks for itself; the tools route ten thousand gates in less than ten minutes. |