B.5. Venkman: The JavaScript Debugger
Venkman is both a graphical and a console debugger. It is one of the most sophisticated examples of a Mozilla application and an indispensable tool for the many developing applications and web pages that rely on JavaScript. Like the DOM Inspector, you can access the JavaScript Debugger from the Tools > Web Development menu (if it was selected during the Mozilla install process). Figure B-3 shows Venkman in action.
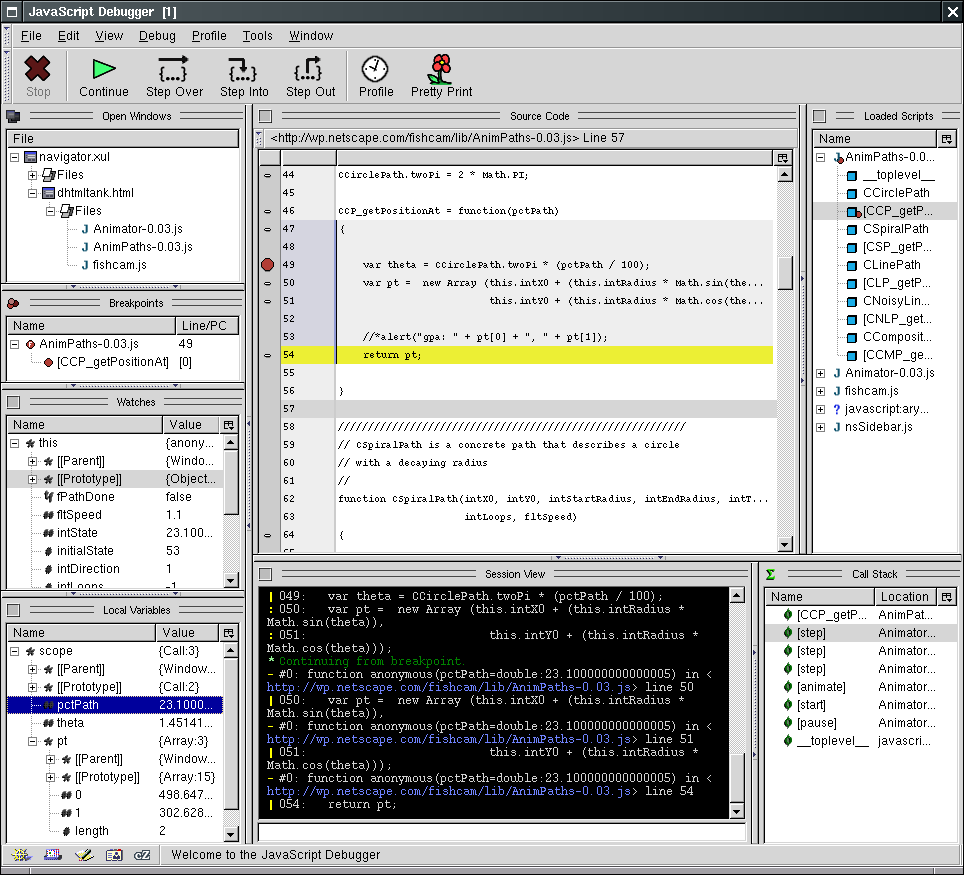
Features such as breakpoint management, call stack inspection, and variable/object inspection are available from both the graphic interface and the console commands. The interactive console allows execution of arbitrary JavaScript code in the context of the target application and in the debugger's own context. Profiling measures the execution time of JavaScript functions during debugging, and pretty printing can re-indent and line wrap a poorly formatted function.
Keyboard shortcuts for the step commands are the same as in other common visual debugging environments, and console users should be familiar with Venkman's break, step, next, finish, frame, and where commands.
Venkman consists of eight main interface elements, referred to as "views." These views display information such as local variables, source code, and the interactive console. They can be detached from the main window to save space on your desktop, or they can be hidden. The Venkman project page at http://www.mozilla.org/projects/venkman/ describes these views and their modes of operation.
Users can use a JavaScript API to add to the set of commands and views provided with Venkman. These add-ons can be shared among a project team or provided to the general public. The details of that API are not yet documented, but examples are found in Venkman itself. If you install Venkman, chrome://venkman/content/venkman-commands.js and chrome://venkman/content/venkman-views.js will contain Venkman's default commands and views.
The following sample session introduces you to the basic commands and use of the JavaScript Debugger. This sample session is based on the version of Venkman available at the time the book was written. To find out how to use the latest version of Venkman, read the Venkman walkthrough at http://www.mozilla.org/projects/venkman/venkman-walkthrough.html.
Invoke the -venkman command-line argument by typing mozilla -venkman to start Mozilla.
You must start the debugger before the scripts it edits can be debugged. If you want to debug the file navigator.xul, for example, then Venkman must load before the main browser window. This limitation will either be fixed or worked around later. For the time being, you need to start the debugger first to debug browser chrome.
Debugging JavaScript components is another example of when scripts must be loaded before the debugger is initialized. Because component registration occurs before command-line processing, when a component changes, it is reloaded at registration time and the debugger does not see it. Currently, the only way to work around it is to start the browser twice: once to re-register the modified component and once to debug it.
Launch a browser window and select "Navigator" from the debugger's Tasks menu.
Type break ContextMenu 357 in the debugger.
The console command break is set and lists breakpoints. The first parameter is the filename that contains the JavaScript you want to break at. The second parameter is the line number. You don't need to specify the entire filename. In this example, we are setting a breakpoint in the function called when the browser wants to create a context menu for web content.
Or, you could select nsContextMenu.js from the Scripts View, locate line 357, and click in the left margin. Setting breakpoints in this way is equivalent to using the break command in the console.
Type break in the debugger.
If you don't provide arguments to the break command, all breakpoints are listed.
Create a context menu in the Navigator window.
A right-click in the content area creates a context menu. You should have hit the breakpoint you just set. The debugger should have displayed "Stopped for breakpoint," along with the filename, line number, and snippet source code where it stopped from.
Type step in the debugger.
This command executes the line of JavaScript we're stopped on and stops again before the next line is executed. The step command is also available via the "Step Into" button on the toolbar and is bound to the F11 key.
In addition to Step In, which executes a single line of JavaScript and stops, Step Over steps over a impending function call and returns control to the debugger when the call returns. Step Out executes until the current function call exits. At this point, you should be at line 359, this.onTextInput = this.isTargetATextBox(elem);.
Type props this in the debugger.
The props command lists an object's properties. The letters and dashes before the values are the flags for that value. The flags are enumerated in Figure B-3, previously shown.
Step one more time.
You should be in the isTargetATextBox function call now.
Type frame in the debugger.
When used without arguments, the frame command shows you the source code for the current frame (with a few lines of context).
Type scope in the debugger.
The scope command lists the current frame's local variables. In this case, there are two locals: node and attrib. The node property is an argument to the function, while attrib is a local variable. The scope is also visible in the Stack View. Open the [isTargetATextBox] frame and the scope node below it.
Type where in the debugger.
The where command lists the current call stack. The frame command can be used to change the current frame to any frame listed here. For example, to view variables in the code that called isTargetATextBox, type frame 1, and scope. To return to the top frame, type frame 0.
Type eval window._content.
The eval command evaluates arbitrary JavaScript in the current frame. Running the eval command on window._content itself isn't very useful, so you'll have to think of something more creative.
Type break.
The break command, when used without arguments, lists the current breakpoints by index.
Type clear 0.
The clear command clears breakpoints. In this example, we clear by breakpoint number, which we got from the break command in the previous step.
Type cont.
The cont command continues execution. The context menu should pop up as it always does.