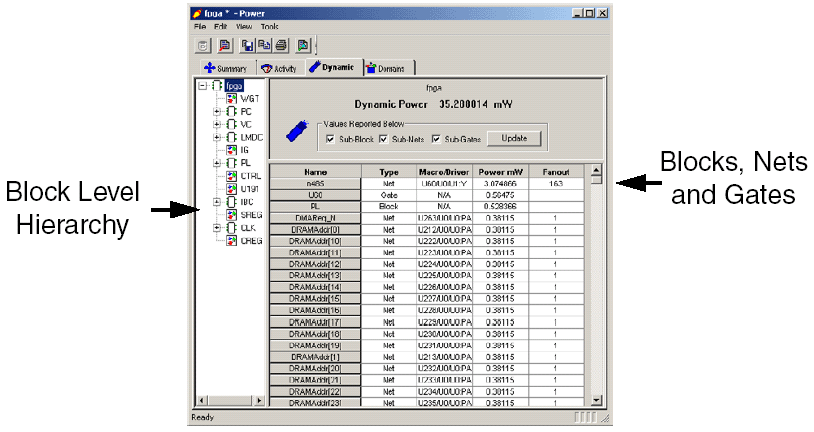
Dynamic Tab Dialog Box
The Dynamic tab displays the estimated power consumption of individual blocks, gates, and nets and enables you to make a hierarchical analysis of your power consumption. The Dynamic tab may also help you to improve your power consumption by identifying the blocks, gates, and nets consuming a significant amount of power.
You can export (to a text file) and print the grid that lists your designís power consumption. To do so, select the elements of the grid that you wish to export or print, and then from the File menu select Export Grid or Print Grid, respectively.
To identify the blocks, gates, or nets that are consuming the most power:
Use the Dynamic tab to expand the design hierarchy. The Dynamic tab enables you to expand your design hierarchy and view a complete list of the blocks in your design. Click the + next to your design to view the hierarchy. Click the + next to a sub-block to view its sub-elements. Consider the figure below, which shows an example of a clock pin with high fanout.

Dynamic Tab Dialog Box
Click to select a block. By default SmartPower selects the design-level block, but you can always select another block in the hierarchical tree. The Report window displays the list of sub-elements of the selected block. By default, this list includes all sub-elements. SmartPower displays the dynamic power consumption of each sub-element with useful information like the fanout and the driver name for a net, or the macro model name for a gate.
Sort and filter the sub-elements to find the block, gate, or net that is using the most power. Double-click a column heading to sort by that column (or to change the sort order). By default, SmartPower sorts the sub-elements according to their power consumption. The top of the list of sub-elements gives you the main sources of dynamic power consumption at the hierarchical level. Select a check box to limit the list of sub-elements to a list of gates, nets, or blocks.