 Bode Plots
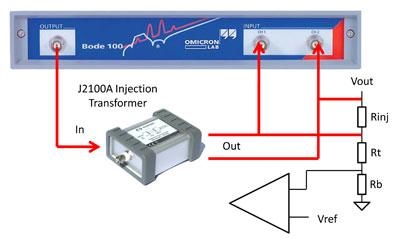
The Bode plot is the most popular method of assessing the stability of the power supply or voltage regulator control loop. The most common measurement technique uses an injection transformer to measure the open loop response in a closed loop system. The quality of the injection transformer is a contributor to the measurement noise and also the measurement bandwidth.
Common issues with Bode plots are that the injection signal is too large, resulting in significant distortion of the bode plot and not measuring to a sufficiently high frequency.
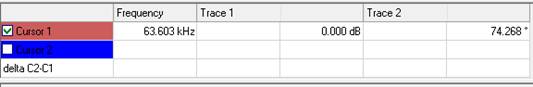
A Bode plot of a 3.3V POL, using the J2101A injection transformer reveals a stable control loop with a bandwidth of 63kHz and a phase margin of 74 Degrees.
An additional crossing is evident at approximately 10MHz, which can also be seen in the output impedance plot, though slightly lower in frequency. This is one reason that it is important to measure the Bode plot to a much higher frequency than the bandwidth.
IN very sensitive or wide bandwidth control loops (either higher or lower frequency) a solid state injector offers the optimum performance. The following bode plots compare the results using a J2100A injection transformer with a J2110A DC-100MHz solid state injector.
J2100A and J2110A noise and fidelity comparison
While these two measurements report the same crossover frequency, phase margin and gain margin, there is significant improvement in both the low frequency noise and the higher frequency response using the solid state injector.
The use of the J2110A solid state injector is even more apparent when measuring the Bode plot (open loop phase gain) of an opamp. The following measurement shows the low noise measurement of an AD820 opamp with 95dB gain and approximately 2MHz zero crossing bandwidth.