Files and Commands
Using .PRB files
.PRB files are ASCII text files where displays, measurement functions, and macros are stored. Each of these are listed in a section in the .PRB file. The section begins with a section header:
The sections can be in any order or not appear at all.
Comment lines begin with an asterisk *. Blank lines are ignored.
Loading .PRB files
Certain .PRB files are automatically loaded by PSpice:
-
The global .PRB file is loaded when a data file is opened. The global .PRB file is specified in the [PROBE] section of the pspice.ini file by the line:
PRBFILE=filename - The local .PRB file is loaded after the global .PRB file. The local .PRB file has the same name as the data file that is being opened. For example, if the data file is named PROJECT.DAT, the local file is named PROJECT.PRB.
You can load a specific .PRB file after the global and local files are loaded by using the command line option -p. For example:
You can also use .PRB files by clicking the Load button in the Display Control, Measurement Functions, or Macro dialog boxes. Only the section is loaded from the .PRB file. For example, if you click Load in the Measurement Function dialog box, only the measurement functions in the specified .PRB file are loaded.
PRB file
A .PRB file is an ASCII file which contains three sections: one for measurement functions, one for macros, and one for display definitions. Each section begins with a header (e.g., [MEASUREMENT FUNCTIONS]).
Measurement functions are stored in a .PRB file. A single .PRB file can contain many measurement function definitions.
Text in a .PRB file
A .PRB file can contain any number of measurement function, macro, and display definitions.
Text in a .PRB file uses the following format:
- Section headers are in brackets—for example, [MACROS].
- Comment lines begin with an asterisk *.
- Blank lines are ignored, so you can add blank lines to improve the readability of the file.
- Lines of text can wrap to the next line. The maximum text line is 255 characters.
Moving data to other applications
You can copy trace data to other applications in two ways: as data or as a bitmap.
Copying bitmaps to another application
Copying data to another application
Copying trace data to another application
You can copy and save trace data to other applications.
To copy trace data to another application
- Click the trace name in the plot legend to select the trace. (The name turns red when selected.)
- From the Edit menu, choose Copy.
- Open a file in another application, such as Microsoft Excel, Microsoft Word, or Notepad.
- From the Edit menu of the other application, choose Paste to paste the data in the file as numbers and text.
- Save the file.
Logging commands
You can use command logging to create a file of commands that you can use at a later date. This file is played back to repeat a series of commands.
- From the File menu, choose Log Commands.
- Type the name of a new file or select an existing file. If you use an existing file, it is over-written with the new command file.
-
Click OK.
All functional actions you make on the screen are logged to the specified file. The resulting file contains actions like opening files, setting axes, and adding traces. -
To stop logging commands, from the File menu, choose Log Commands again.
- From the File menu, choose Run Commands.
- Select the file from the list. If the file is in a different directory or drive, select the correct file or directory from the lists.
- Click OK. to play the file immediately on your screen.
Creating and changing macros
Macros can contain constraints, functions, and/or expressions of any or all of these. Macros are used when specifying a trace to add. Macros can refer to other macros, but recursive definitions are not allowed.
You can define, load, save, and delete macro definitions. Macros are stored in a .PRB file.
For more information, see the following topics:
To add a macro
- From the Functions or Macros list, select Macro.
- From the corresponding list, select the name of the macro.
- Fill in the arguments list, using the macro syntax format:
To create a new macro
- From the Trace menu, choose Macros.
- In the Definition text box, type a unique name and a definition for the macro, observing the macro rules.
-
Click the Save button to save the macro.
To modify an existing macro
- From the Trace menu, choose Macros.
- From the list, select a macro.
- In the Definition text box, edit the macro definition, observing the macro rules.
- To save the modified macro, do one of the following:
To load a macro
- From the Trace menu, choose Macros.
- Click the Load button.
- Select the file you want to load and click Open.
To delete a macro
To delete a macro from another file
- From the Trace menu, choose Macros.
- Click the Delete From button.
- Select the remote or global .PRB file that has the macro you want to delete.
-
Click Open to delete the macro.
Macro syntax and examples
A macro can have a maximum of 80 characters, including macro name and arguments. Macros can refer to other macros, but recursive definitions are not allowed. Arguments are enclosed in parentheses ( ) without spaces. A line beginning with an asterisk * is a comment line. In-line comments are marked with a semicolon after the macro definition. Blank lines are ignored.
<macro name>[(arg[,arg]*)] = <definition>
CSDF
When you (?) the Save Data in the CSDF Format option in the data collection options for simulation profiles, the simulation results are generated in generic ASCII text so that any computer link can handle the file transfer and so that any computer platform can process the data. The default file name extension for CSDF files is .CSD.
Binary
Binary files are compact and provide the quickest access to the waveform data.
However, binary files can present problems if you want to manipulate the data, or when you want to transfer the data file to a different type of computer. There are several problems that you can encounter. Examples include:
- Binary formats for real numbers differ between platforms
- Link between computers cannot handle binary data adequately
- Binary data format is difficult to access or process
Specifying default command line options
To start PSpice with a set of customized options that will be used each time a simulation is run, you can modify the initialization file (pspice.INI).
- Open the file pspice.ini (located in the Windows directory) in any ASCII text editor, such as Notepad.
-
Under the heading [PSpice ] add the following command line with the desired switches:
PSPICECMDLINE=<option1> <option2> - Save the file.
For more detailed information on defining simulation command line options in PSpice and a listing of the valid options, see the PSpice Reference Guide.
Configuring the pspice.INI file
The pspice.ini file is an ASCII text file that contains the initialization settings for PSpice and other applications that run with PSpice. It controls how PSpice application programs are started, and how their environment and initialization settings are defined. The pspice.ini file is created when you perform the installation process.
Under normal installations to your local hard drive, the pspice.ini file is located in the directory where the PSpice executable (pspice.exe) is installed (typically, in <installation>\tools\pspice). The file is divided into sections with title names enclosed in brackets.
Each section contains settings which follow the format:
where the <keyword> is the name of the setting and <value> defines the value of that setting.
For example, the first section is [PSPICE]. The setting:
LIBPATH=”C:\Cadence\SPB_17.4\tools\pspice\library”
indicates that the LIBPATH setting will point to the directory C:\Cadence\SPB_17.4\tools\pspice\library, where the PSpice model libraries are typically installed.
Changing the settings
When the pspice.ini file is created (during installation), the installation assigns default values to the settings. Most of the settings can be changed through dialog boxes within PSpice or Probe. However, some settings may only be modified with a text editor.
You can change the default settings using any standard text editor, such as Notepad.
To change items that are configurable through the text editor, you should note that:
- The <keyword> is followed by an equals sign (=) with no spaces in-between.
- The <value> can be an integer, a string, or a quoted string, depending on the setting; start typing the <value> immediately after the equals sign.
- For settings that turn a feature on or off, the <value> should be either ON or OFF.
- You can include comments within the file, but you must begin each comment line with a semicolon (;).
Section descriptions
The pspice.ini file consists of several sections that define the configuration settings for the various PSpice applications. The descriptions listed below provide information on the elements within each of these sections in pspice.ini. The descriptions provide details on the permissible <keyword> and <value> settings.
For specific information about a particular section, click the buttons next to the section titles listed below. (The sections are listed here in alphabetical order for easy reference. They are typically arranged in a different order in the actual pspice.ini file.)
PART LIBS section
The [PART LIBS] section lists the part libraries that are configured for use in PSpice Schematic to Capture translation. The individual entries in the listing can be edited in the form:
LIB1=<library name> [extension]
where <library name> is the name of the library file (ANALOG) and [extension] is the extension for the library file. You may list multiple extensions.
PROBE section
The [PROBE] section defines the configuration settings used by Probe. The following table describes the different settings. The settings are listed here in alphabetical order for easy reference, but they may appear in any order in the pspice.ini file.
PROBE DISPLAY COLORS section
The [PROBE DISPLAY COLORS] section defines the color settings used by Probe. The following table describes the different settings. The settings are listed here in alphabetical order for easy reference, but they may appear in any order in the pspice.ini file.
To change the settings in the [PROBE DISPLAY COLORS] section, use the format:
where <item name> specifies the Probe item and <color> specifies the color.
For example, the entry FOREGROUND=DARKGREEN results in graph axes being drawn in dark green, Or, BACKGROUND=CYAN results in the screen background changing to the color cyan instead of the default color black.
Alternatively, you may specify varying degrees of color by using the RGB (red, green, blue) value of the color you desire. For example, TRACE_2=255 0 0 is the same as TRACE_2=RED.
The available colors are: black, blue, brown, brightwhite, cyan, darkblue, darkcyan, darkgray, darkgreen, darkmagenta, darkred, green lightgray, magenta, red, and yellow.
In some cases you may want to limit the number of colors used for drawing. For a super VGA display, the default maximum number of colors (NUMTRACECOLORS) is twelve.
PROBE PRINTER COLORS section
The [PROBE PRINTER COLORS] section defines the color settings used for printing from Probe. The following table describes the different settings. The settings are listed here in alphabetical order for easy reference, but they may appear in any order in the pspice.ini file.
To change the settings in the [PROBE PRINTER COLORS] section, use the format:
where <item name> specifies the Probe item and <color> specifies the color.
For example, the entry FOREGROUND=DARKGREEN results in graph axes being printed in dark green. The default maximum number of colors is twelve.
The available colors are: black, blue, brown, brightwhite, cyan, darkblue, darkcyan, darkgray, darkgreen, darkmagenta, darkred, green lightgray, magenta, red, and yellow.
If you are using a four pen plotter, you will get the best results if you set the maximum number of colors to three. The first three trace colors will be used for the colors of digital traces.
PSPICE section
The [PSPICE] section contains settings that are specific to PSpice. The following table describes the different settings. The settings are listed here in alphabetical order for easy reference, but they may appear in any order in the PSPICE.INI file.
Command line options for the PSpice applications are explained in much more detail in the PSpice Reference Guide.
LIBPATH
This variable is originally set during installation to the directory:
LIBPATH=C:\Program Files\Orcad\Capture\ Library\PSpice
If you install the PSpice applications into another directory, then a corresponding subdirectory will be created under your named directory.
For example, if you specify C:\Mydir as the directory where PSpice should be installed, then your LIBPATH variable will be set to:
LIBPATH=C:\Mydir\Orcad\Capture\Library\ PSpice
You can specify more than one directory for LIBPATH by separating the paths with a semicolon (;). When a library file is referenced, PSpice will search for the file in the directories in the order specified by this variable. You can change the LIBPATH variable by editing this line in the form:
LIBPATH=<directory>;<directory>;...;<directory>
For example, if you want PSpice to search for model library files in more than one place, you could set the variable to:
LIBPATH=C:\Program Files\Orcad\Capture\ Library\PSpice ; D:\ProjectA\Library
In this case, PSpice will look first for a library file in C:\Program Files\Orcad\Capture\Library\PSpice. If it finds the specified library file here, it will stop searching. Otherwise, PSpice will then search for the specified library file in D:\ProjectA\Library.
PSpice NETLIST section
The [PSpice NETLIST ] section contains settings that specify which model library files should be processed when generating a PSpice simulation netlist.
The typical setting created during installation will appear in the form:
You can specify more than one library file to include in the netlist generation process. The library files you specify will be searched in the order in which they are listed.
For example, if you have three different sets of model libraries that should be searched and processed during netlist generation, list them as follows:
SUBCKT SETTING section
The [SUBCKT SETTING] section defines how various parameters in subcircuits are processed when a hierarchical netlist is generated. The following table describes the different settings. The settings are listed here in alphabetical order for easy reference, but they may appear in any order in the pspice.ini file.
Calculating Hysteresis Core Loss
The Hysteresis Core Loss application calculates the area of the B-H curve, which is the integrated average of B-H loops, on the basis of the specified time range, that is, the start time and end time.
If the specified time range covers more than 50 B-H loops, the area of the B-H curve is calculated using the first 50 B-H loops. If the specified time range covers less than 50 B-H loops, the area of the B-H curve is calculated using the number of the loops covered within the specified time range.
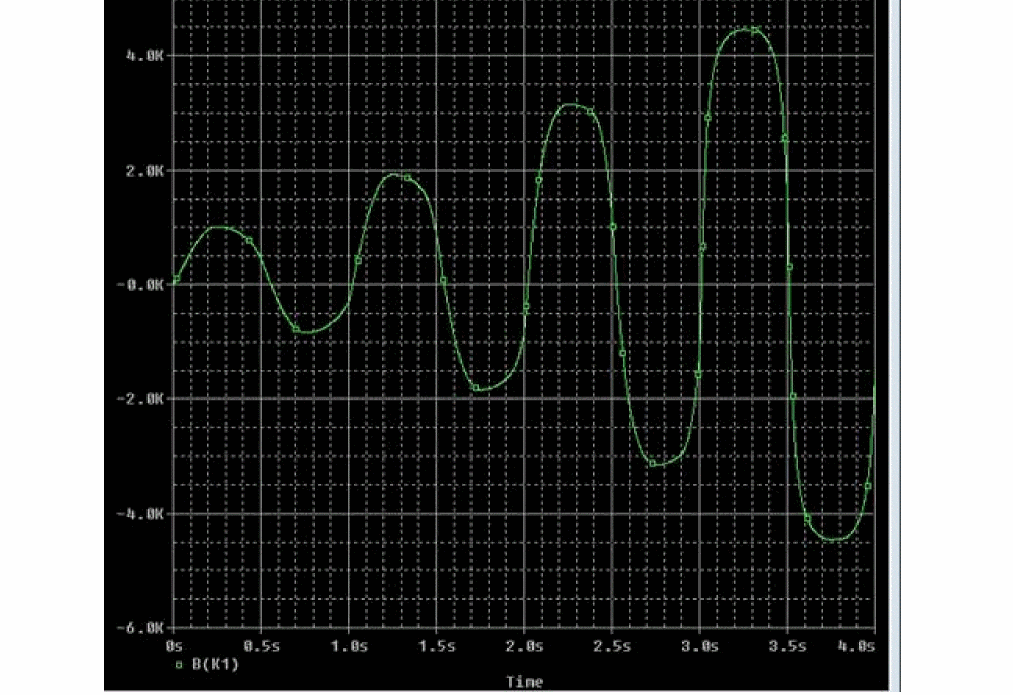
The following figures illustrate an example where the circuit is in the transient state.

Figure 12-1 Transient State of the circuit
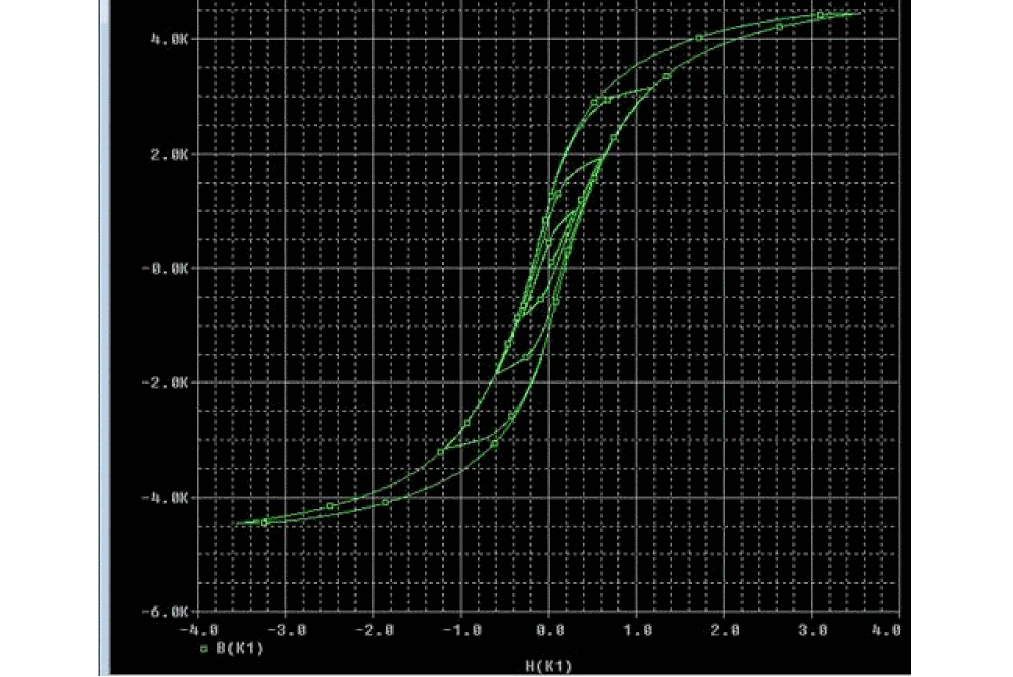
Note that in Figure 12-1, the time range for the B-H loops is from 0 to 4 seconds and the B-H loops, as shown in Figure 12-2, do not overlap as the B-H values are different for each loop.

Figure 12-2 B-H Curve of the Circuit’s Transient State
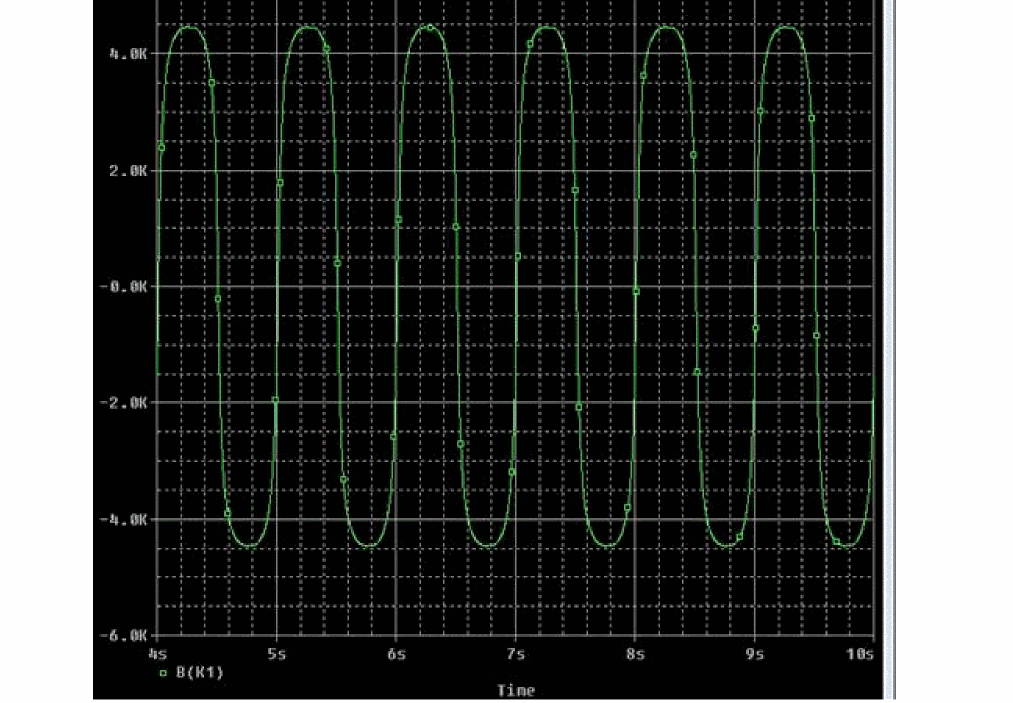
The following figures illustrate an example of the steady-state behavior of the circuit in the specified time range of 4 to 10 seconds.
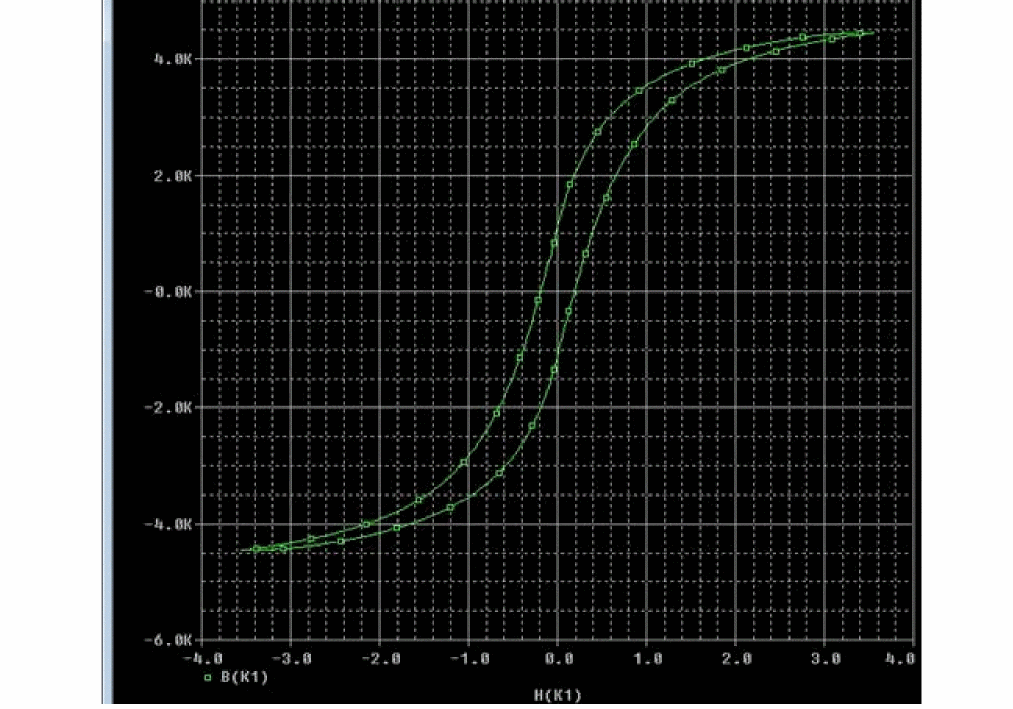
Note that the B-H loops, as shown in the Figure 12-4, overlap as the circuit is in its steady state. The core loss of the circuit’s steady state is calculated if the specified time range is from 4 to 10 seconds.

Figure 12-3 Steady State of the circuit

Figure 12-4 B-H Curve of the circuit’s steady state
Return to top