![\includegraphics[scale=0.5]{eps/ComplexPlane}](img172.png) |
We can plot any complex number ![]() in a plane as an ordered pair
in a plane as an ordered pair
![]() , as shown in Fig.2.2. A complex plane (or
Argand diagram) is any 2D graph in which the horizontal axis is
the real part and the vertical axis is the imaginary
part of a complex number or function. As an example, the number
, as shown in Fig.2.2. A complex plane (or
Argand diagram) is any 2D graph in which the horizontal axis is
the real part and the vertical axis is the imaginary
part of a complex number or function. As an example, the number ![]() has coordinates
has coordinates ![]() in the complex plane while the number
in the complex plane while the number ![]() has
coordinates
has
coordinates ![]() .
.
Plotting ![]() as the point
as the point ![]() in the complex plane can be
viewed as a plot in Cartesian or
rectilinear coordinates. We can
also express complex numbers in terms of polar coordinates as
an ordered pair
in the complex plane can be
viewed as a plot in Cartesian or
rectilinear coordinates. We can
also express complex numbers in terms of polar coordinates as
an ordered pair
![]() , where
, where ![]() is the distance from the
origin
is the distance from the
origin ![]() to the number being plotted, and
to the number being plotted, and ![]() is the angle
of the number relative to the positive real coordinate axis (the line
defined by
is the angle
of the number relative to the positive real coordinate axis (the line
defined by ![]() and
and ![]() ). (See Fig.2.2.)
). (See Fig.2.2.)
Using elementary geometry, it is quick to show that conversion from rectangular to polar coordinates is accomplished by the formulas
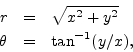
where
![]() denotes the arctangent of
denotes the arctangent of ![]() (the angle
(the angle
![]() in radians whose tangent is
in radians whose tangent is
![]() ). We will
take
). We will
take ![]() in the range
in the range ![]() to
to ![]() (although we could choose
any interval of length
(although we could choose
any interval of length ![]() radians, such as 0 to
radians, such as 0 to ![]() , etc.).
, etc.).
The notation
![]() means ``the angle whose tangent is
means ``the angle whose tangent is
![]() , taking the quadrant of the vector
, taking the quadrant of the vector ![]() into account.'' In
Matlab and Octave, atan2(y,x) performs the
``quadrant-sensitive'' arctangent function. On the other hand,
atan(y/x), like the more traditional mathematical notation
into account.'' In
Matlab and Octave, atan2(y,x) performs the
``quadrant-sensitive'' arctangent function. On the other hand,
atan(y/x), like the more traditional mathematical notation
![]() does not ``know'' the quadrant of
does not ``know'' the quadrant of ![]() , so it maps
the entire real line to the interval
, so it maps
the entire real line to the interval
![]() . As a specific
example, the angle of the vector
. As a specific
example, the angle of the vector
![]() (in quadrant I) has the
same tangent as the angle of
(in quadrant I) has the
same tangent as the angle of
![]() (in quadrant III).
Similarly,
(in quadrant III).
Similarly,
![]() (quadrant II) yields the same tangent as
(quadrant II) yields the same tangent as
![]() (quadrant IV).
(quadrant IV).
The formula
![]() for converting rectangular
coordinates to radius
for converting rectangular
coordinates to radius ![]() , follows immediately from the
Pythagorean theorem, while the
, follows immediately from the
Pythagorean theorem, while the
![]() follows from the definition of the tangent
function itself.
follows from the definition of the tangent
function itself.
Similarly, conversion from polar to rectangular coordinates is simply
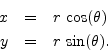
These follow immediately from the definitions of cosine and sine, respectively.