 |  |

A simple first step in diagnosing a performance problem is to break down performance into five categories:
DNS lookup time
Connection setup time
Server silence
Transmission time
Connection close time.
These steps always happen in this order.
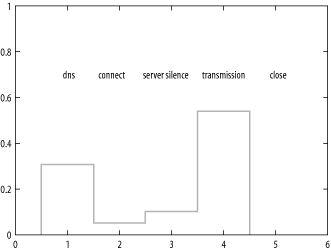
A tool that automatically times each of these 5 steps and generates a graph of the results (with advice) is analysis.cgi, which you can run from http://patrick.net. Simply enter a URL and it will try to graph the breakdown of these components for that URL. Figure 20-1 shows an example output graph.

The advice for http://patrick.net is as follows:
advice for http://patrick.net/

DNS

I spent a cumulative 0.4052 seconds resolving hostnames. No problem with DNS.

network

It took a cumulative total of 0.0650 seconds to set up the connections to
download your content.  The average time to connect was 0.0325 seconds.  The
latency to make a connection to your site was OK.  I spent 0.0012 seconds
closing the socket.

server

There was a cumulative 0.1334 seconds of server silence.  The average period
of server silence was 0.0667 seconds.  Your server is using HTTP 1.1, which
has better performance than HTTP 1.0. Good.

content

Your content was a total of 4984 bytes, including headers.  It would take at
least 0.7120 seconds to download the content over a 56 Kbps modem.  It would
take at least 0.0791 seconds to download the content over a 500 Kbps DSL line.

Your content size is well suited for surfing with a 56K modem: less than 3
seconds.  Here are URLs of the 2 elements on the page, with server response
headers:

    http://patrick.net:80/webpt_sm.gif
    HTTP/1.1 200 OK
    Date: Mon, 23 Apr 2001 19:14:29 GMT
    Server: Apache/1.3.9 (Unix)
    Last-Modified: Tue, 07 Nov 2000 05:56:29 GMT
    ETag: "11aaa93-865-3a07998d"
    Accept-Ranges: bytes
    Content-Length: 2149
    Connection: close
    Content-Type: image/gif

http://patrick.net/

HTTP/1.1 200 OK
Date: Mon, 23 Apr 2001 19:14:29 GMT
Server: Apache/1.3.9 (Unix)
Last-Modified: Sat, 03 Mar 2001 22:56:46 GMT
ETag: "11aaa81-929-3aa176ae"
Accept-Ranges: bytes
Content-Length: 2345
Connection: close
Content-Type: text/html

Multiple copies of the same element are counted only once, on the assumption
that the browser is smart enough to reuse them.

summary

The total is 1.3168 seconds.
The bottleneck was transmission.
We are told that the bottleneck was transmission time. The best way to make this page faster is to get it from a faster connection. A total content size of 4984 bytes is already small, so there's not much room for improvement there. There is little point in making the servers faster in this case because the potential gain from increased server speed is so small.
Here are some general guidelines for the five possible bottlenecks:
If DNS is the bottleneck, then either the analysis.cgi client needs to point to a faster DNS server, or your web site's name needs to be more aggressively propagated to DNS servers around the Internet, where it will be cached. A more popular site will be a bit faster because the DNS-to-IP mapping will already be cached in many DNS servers.
If connection time is the bottleneck, then there is a network problem. Maybe a packet was lost during connection setup because of an overloaded hub. Routers, interfaces, and cable should be examined for errors.
If server silence is the bottleneck, then the server is overloaded in some way and could probably benefit from better hardware or a more optimized server application or database.
If transmission time is the bottleneck, then client connection speed is too small or the content you are trying to push down it is too large.
If connection close is the bottleneck, again we have a network problem.

Copyright © 2003 O'Reilly & Associates. All rights reserved.