 |  |

You can set up an automated system to monitor web performance using Perl and gnuplot. It uses the LWP library to grab a web page and then deals with proxies, handling cookies, handling SSL, and handling login forms. Here's the basic code for getting the home page, logging in, logging out, and graphing all the times. Try to run monitoring and load testing from a machine that sits on the same LAN as the web server. This way, you know that network latency is not the bottleneck.
#!/usr/local/bin/perl -w

use LWP::UserAgent;
use Crypt::SSLeay;
use HTTP::Cookies;
use HTTP::Headers;
use HTTP::Request;
use HTTP::Response;
use Time::HiRes 'time','sleep';

# constants:

$DEBUG       = 0;
$browser     = 'Mozilla/4.04 [en] (X11; I; Patrix 0.0.0 i586)';
$rooturl     = 'https://patrick.net';
$user        = "pk";
$password    = "pw";
$gnuplot     = "/usr/local/bin/gnuplot";

# global objects:

$cookie_jar  = HTTP::Cookies->new;
$ua          = LWP::UserAgent->new;

MAIN: {
  $ua->agent($browser); # This sets browser for all uses of $ua.

  # home page
  $latency = &get("/home.html");
  # verify that we got the page
  $latency = -1 unless index "<title>login page</title>" > -1;
  &log("home.log", $latency);
  sleep 2;

  $content = "user=$user&passwd=$password";

  # log in
  $latency = &post("/login.cgi", $content);
  $latency = -1 unless m|<title>welcome</title>|;
  &log("login.log", $latency);
  sleep 2;

  # content page
  $latency = &get("/content.html");
  $latency = -1 unless m|<title>the goodies</title>|;
  &log("content.log", $latency);
  sleep 2;

  # logout
  $latency = &get("/logout.cgi");
  $latency = -1 unless m|<title>bye</title>|;
  &log("logout.log", $latency);

  # plot it all
  `$gnuplot /home/httpd/public_html/demo.gp`;
}

sub get {
  local ($path) = @_;

  $request = new HTTP::Request('GET', "$rooturl$path");

  # If we have a previous response, put its cookies in the new request.
  if ($response) {
      $cookie_jar->extract_cookies($response);
      $cookie_jar->add_cookie_header($request);
  }

  if ($DEBUG) {
      print $request->as_string();
  }

  # Do it.
  $start    = time();
  $response = $ua->request($request);
  $end      = time();
  $latency  = $end - $start;

  if (!$response->is_success) {
      print $request->as_string(), " failed: ",
      $response->error_as_HTML;
  }

  if ($DEBUG) {
      print "\n## Got $path and result was:\n";
      print $response->content;
      print   "## $path took $latency seconds.\n";
  }

  $latency;
}

sub post {

  local ($path, $content) = @_;

  $header  = new HTTP::Headers;
  $header->content_type('application/x-www-form-urlencoded');
  $header->content_length(length($content));

  $request = new HTTP::Request('POST',
                               "$rooturl$path",
                               $header,
                               $content);

  # If we have a previous response, put its cookies in the new request.
  if ($response) {
      $cookie_jar->extract_cookies($response);
      $cookie_jar->add_cookie_header($request);
  }

  if ($DEBUG) {
      print $request->as_string();
  }

  # Do it.
  $start    = time();
  $response = $ua->request($request);
  $end      = time();
  $latency  = $end - $start;

  if (!$response->is_success) {
      print $request->as_string(), " failed: ", $response->error_as_HTML;
  }

  if ($DEBUG) {
      print "\n## Got $path and result was:\n";
      print $response->content;
      print   "## $path took $latency seconds.\n";
  }

  $latency;
}

# Write log entry in format that gnuplot can use to create an image.
sub log {

  local ($file, $latency) = @_;
  $date = `date +'%Y %m %d %H %M %S'`;
  chop $date;
  # Corresponding to gnuplot command: set timefmt "%m %d %H %M %S %y"

  open(FH, ">>$file") || die "Could not open $file\n";

  # Format printing so that we get only 4 decimal places.
  printf FH "%s %2.4f\n", $date, $latency;

  close(FH);
}
This gives a set of log files with timestamps and latency readings. To generate a graph from that, you need a gnuplot configuration file. Here's the gnuplot configuration file for plotting the home page times.
set term png color
set output "/home/httpd/public_html/demo.png"
set xdata time
set ylabel "latency in seconds"
set bmargin 3
set logscale y
set timefmt "%Y %m %d %H %M %S"
plot "demo.log" using 1:7 title "time to retrieve home page"
Note that the output is set to write a PNG image directly into the web server's public_html directory. This way, you can merely click on a bookmark in your browser to see the output. Now just set up a cron job to run the monitor script every minute and you will have a log of the web page's performance and a constantly-updated graph. Use crontab -e to modify your crontab file. Here's an example entry in a crontab file.
# MIN   HOUR    DOM     MOY     DOW     Commands
#(0-59) (0-23)  (1-31)  (1-12)  (0-6)   (Note: 0=Sun)
*       *        *       *       *      cd /home/httpd/public_html; ./monitor
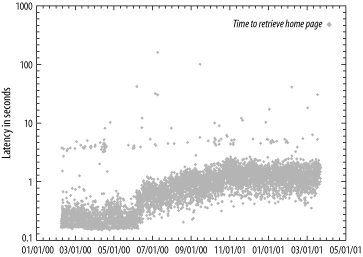
Figure 20-2 shows an example output image from a real site monitored for over a year.

Instead of running from cron, you could turn your monitoring script into a functional test by popping up each page in a Netscape browser as you get it, so you can see monitoring as it happens and also visually verify that pages are correct in addition to checking for a particular string on the page in Perl. For example, from within Perl, you can pop up the http://www.oreilly.com page in Netscape like this:
system "netscape -remote 'openURL(http://www.oreilly.com)'";
You can redirect the browser display to any Unix machine running X Windows, or any Microsoft Windows machine using an X Windows server emulator like Exceed. This capability of Netscape to be controlled from a script is described at http://home.netscape.com/newsref/std/x-remote.html.
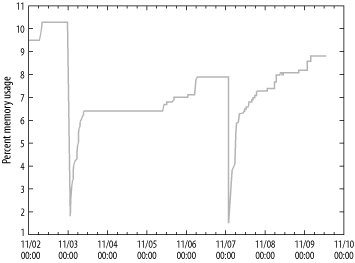
There are many other things you can monitor besides raw performance. It is extremely useful to have an image of how much memory you are using. This allows you to visually see memory leaks, which can eventually crash your server. Memory leaks are memory allocations that get "lost," that is, lost track of by the application because of poor programming. There is no fix except stricter accounting of memory allocations and deallocations. Figure 20-3 shows an image of a memory leak in a web application, showing restarts on 11/3 and 11/7.

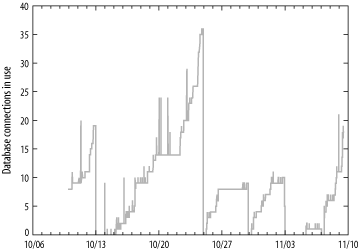
Likewise, you can monitor database connections in use and create an image of a database connection leak, which is another common source of slowdowns and crashes. Database connection leaks have causes similar to memory leaks. Database connections are typically leaked in Java exceptions when the exception handling code does not release the connection. Figure 20-4 shows a graph showing how database connections build up between restarts of a Weblogic application server. The server was restarted 10/13, 10/25, 10/30, and 11/3.

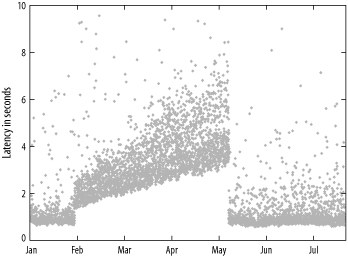
Monitoring web performance can help diagnose the common error of creating an unindexed database table growing without limit. A SQL SELECT statement using such a table will get slower and slower as the table grows. In Figure 20-5, you see the result of introducing a select from a large unindexed table in February, while the table continued to grow. When an index on that table was finally created in May, latency returned to normal.

Detailed instructions on how to set up your own monitoring and graphing system to make images like these can be found in Web Performance Tuning.
A final tip for system administrators: the recently introduced "selective acknowledgment" performance feature of TCP does not work with some old TCP stacks and older DSL hardware. Selective acknowledgment, or SACK, is defined in RFC 2018. The symptom is that browsers are occasionally sent blank pages and network error messages. Selective acknowledgment is supposed to work like this: say a server sends out four packets to a browser. Packet 2 gets lost while packets 1, 3, and 4 arrive just fine. Without selective acknowledgment, all a client can do is say that all packets arrived, or that they did not, and let the server time out and resend all 4 packets. But with selective acknowledgment, the client can tell the server exactly which packet was missing. This is a significant help to performance on lossy connections.
If you see some clients having network trouble upon upgrading your server to Solaris 8, this bug could be the cause. As of Solaris 8 the ndd parameter tcp_sack_permitted is 2. To fix the bug, you need only set it back to 1 or 0. The meanings of the 3 values of tcp_sack_permitted in Solaris's ndd command are:
Web performance is an ongoing challenge, but because of the widespread use of simple open standards like TCP/IP and HTTP, web performance problems are always understandable and solvable.

Copyright © 2003 O'Reilly & Associates. All rights reserved.