![[DBPP]](pictures/asm_color_tiny.gif)


![[Search]](pictures/search_motif.gif)
Next: 9.3 Data Transformation and Visualization
Up: 9 Performance Tools
Previous: 9.1 Performance Analysis
Next, we examine in more detail the
techniques used
to collect performance data. We consider in turn profiling, counters,
and event traces, focusing in each case on the principles involved.
Individual tools are described in Section 9.4.
The concept of a profile should be familiar from sequential computing.
Typically, a profile shows the amount of time spent in
different program components. This information is often obtained by
sampling techniques, which are simple but not necessarily highly
accurate. The value of the program counter is determined at fixed
intervals and used to construct a histogram of execution frequencies.
These frequences are then combined with compiler symbol table
information to estimate the amount of time spent in different parts of
a program. This profile data may be collected on a per-processor
basis and may be able to identify idle time and communication time as
well as execution time.
Profiles have two important advantages. They can be obtained
automatically, at relatively low cost, and they can provide a
high-level view of program behavior that allows the programmer to
identify problematic program components without generating huge
amounts of data. (In general, the amount of data associated with a
profile is both small and independent of execution time.) Therefore,
a profile should be the first technique considered when seeking to
understand the performance of a parallel program.
A profile can be used in numerous ways. For example, a single profile
on a moderate number of processors can help identify the program
components that are taking the most time and that hence may require
further investigation. Similarly, profiles performed for a range of
processor counts and problem sizes can identify components that do not
scale.
Profiles also have limitations. In
particular, they do not incorporate temporal aspects of program
execution. For example, consider a program in which every processor
sends to each other processor in turn. If all processors send to
processor 0, then to processor 1, and so on, overall performance may
be poor. This behavior would not be revealed in a profile, as every
processor would be shown to communicate the same amount of data.
Profilers are available on most parallel computers but vary widely in
their functionality and sophistication. The most basic do little more
than collect sequential profile data on each processor; the most
sophisticated provide various mechanisms for reducing this data,
displaying it, and relating it to source code. Because efficient
profiling requires the assistance of a compiler and runtime system,
most profiling tools are vendor supplied and machine specific.
As its name suggests, a counter is a storage location that can be
incremented each time a specified event occurs. Counters
can be used to record the number of procedure calls, total number of
messages, total message volume, or the number of messages sent between
each pair of processors. Counts may be generated by
compiler-generated code, by code incorporated in communication
libraries, or by user-inserted calls to counter routines.
Counters complement profilers by providing information that is not
easily obtainable using sampling techniques. For example, they
can provide the total number and volume of messages, information that
can be combined with communication time data from a profile to
determine the efficiency of communication operations.
A useful variant of a counter is an interval timer, a timer used
to determine the length of time spent executing a particular piece of
code. This information can be accumulated in a counter to provide an
accurate determination of the total time spent executing that program
component. A disadvantage of interval timers is that the logic
required to obtain a timer value can be expensive.
The use of counters and interval timers in a computational chemistry
code was illustrated in Section 3.6: see
in particular
Tables 3.4 and 3.5.

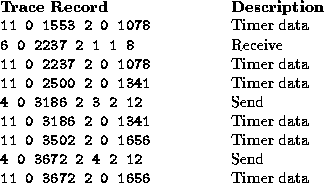
Figure 9.1: Trace records generated by the Portable Instrumented
Communication Library. The various records contain information
regarding the type of event, the processor number involved, a time
stamp, and other information. Clearly, these records are not meant to
be interpreted by humans.
An execution trace is the most detailed and low-level approach to
performance data collection. Trace-based systems typically generate
log files containing time-stamped event records representing
significant occurrences in a program's execution, such as calling a
procedure or sending a message. Trace records may include
information such as the type of event and the procedure name or
destination task, and can be generated either automatically or under
programmer control. Figure 9.1 shows an example of
trace records.
Trace-based approaches support a particularly broad study of program
behavior. They can be used to examine causal relationships between
communications, to localize sources of idle time, and to identify
temporary hot spots. For example, an execution trace could be used to
determine that all processors are sending to the same processor at the
same time. An execution trace can also be postprocessed to obtain
profile, count, and interval timer information; to compute
higher-order statistics such as the means and variances of these
values; and to obtain other data such as mean message queue length in
a message-passing system.
The disadvantages of trace-based approaches stem primarily from the
huge volume of data that can be generated. Particularly when a
program is executing on large numbers of processors, it is easy to
generate tens, hundreds, or even thousands of megabytes of data. (For
example, if a 20-byte record is logged for every message on a
128-processor system, then assuming messages are sent at the rate of
one every 10 milliseconds, trace data will be generated at
256 kilobytes per second, or about 1 gigabyte per hour.) This large
data volume has three unwelcome consequences. First, the logging of
this data tends to perturb performance, thereby leading to what is
called the probe effect
in which the measuring of
performance data changes their characteristics. Second, the sheer
volume of data makes postprocessing difficult. Frequently,
sophisticated analysis is required to extract relevant information.
Third, the programmer, in order to combat the problems caused by
volume, may have to spend considerable effort tuning the data
collection process so that only relevant events are recorded while the
phenomenon of interest is retained. Tracing then becomes a
labor-intensive process. For these reasons, tracing should be used with
care and only if other data collection techniques are not available
or do not provide sufficient information.
Many parallel programming tools provide some automatic tracing
capabilities, for example by generating a trace record for every
message generated or received. These capabilities are invoked by
linking with a specialized version of a communication library and/or
by a runtime flag. Mechanisms for generating user-defined events may
also be provided.
In principle, event traces can be interpreted in various
ways by using different tools. A stumbling block here
is a lack of standards for event log records. One proposed
standard is the Pablo Self Describing Data Format (SDDF) designed at the
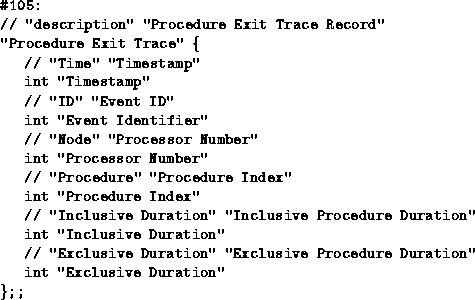
University of Illinois. As illustrated in Figure 9.2,
this associates an integer event type with a record description that
specifies a type and name for each field.

Figure 9.2: An example of the Pablo Self Describing Data Format.
The data record "Procedure Exit Trace" has an event type of 105
and six data fields, all integers.
A broad spectrum of data collection mechanisms can be used to obtain
information about parallel program performance. In general, those
requiring the least programmer intervention are also the least
intrusive and provide the highest-level, least-detailed view of
program behavior; those providing greater detail are progressively
more intrusive and demand more programmer effort. Hence, for maximum
programmer efficiency, the process of collecting and interpreting
performance data should proceed in a staged manner, as follows.
-
Use profile and count information to obtain any parameter values
needed to complete performance models.
-
Measure execution times for a range of processor counts and problem
sizes, and compare these results with values predicted by performance
models.
-
If observed and modeled performance differ significantly, use profile
and count information to verify the basic assumptions underlying your
model. For example, check that message counts and volumes match your
predictions, and check for load imbalances and replicated computation
(Section 3.6).
-
If there are still unexplained aspects of program performance,
incorporate simple tracing (or enable automatic tracing capabilities),
and study performance on a few processors. Increase the number of
processors as your understanding improves.
Of course, the actual path followed to obtain performance data will
also depend on the functionality provided in a particular parallel
programming system.
![[DBPP]](pictures/asm_color_tiny.gif)


![[Search]](pictures/search_motif.gif)
Next: 9.3 Data Transformation and Visualization
Up: 9 Performance Tools
Previous: 9.1 Performance Analysis
© Copyright 1995 by Ian Foster

![[DBPP]](pictures/asm_color_tiny.gif)


![[Search]](pictures/search_motif.gif)
