Table of Contents
Let’s take a break from pure text and numbers to investigate OpenDocument’s graphic elements. Before we get to the actual objects that you can draw on a page, we have to discuss the general format of the file.
An <office:master-styles> element follows the <office:automatic-styles> in the styles.xml file. It defines the layers of a drawing and the master page. Example 6.1, “Master Styles in a Draw Document” shows this element:
Example 6.1. Master Styles in a Draw Document
  <draw:layer-set>
    <draw:layer draw:name="layout"/>
    <draw:layer draw:name="background"/>
    <draw:layer draw:name="backgroundobjects"/>
    <draw:layer draw:name="controls"/>
    <draw:layer draw:name="measurelines"/>
</draw:layer-set>

<style:master-page style:name="Default"
    style:page-master-name="PM1" draw:style-name="dp1"/>
These layers, unlike layers in most drawing programs, do not determine the stacking order of objects. They are just separate workspaces for holding various parts of the drawing. The layout layer contains most of your ordinary graphics. The controls layer contains buttons with actions attached to them (we won’t examine those in this chapter). The measurelines layer contains lines which automatically calculate and display linear dimensions. The background and backgroundobjects layers are used in presentation documents, which we will cover in Chapter 7, Presentation.
OpenDocument drawing documents have an <office:drawing> element as the first child of the <office:body>. The <office:automatic-styles> element will start with an element like this:
<style:style style:name="dp1" style:family="drawing-page"/>
This is followed by all the styles to be applied to the document’s graphic objects. Font specification is handled differently in a drawing file than it is in a word processing file. Instead of office:font-face-decls in the styles.xml file, font specifications are attached to the styles in the content.xml file. Instead of using svg:font-family, a drawing uses fo:font-family. Example 6.2, “Font Specification in a Drawing” shows a style for a paragraph in a drawing.
Example 6.2. Font Specification in a Drawing
<style:style style:name="P3" style:family="paragraph">
	<style:paragraph-properties
		fo:margin-left="0cm" fo:margin-right="0cm"
		fo:text-indent="0cm"/>
	<style:text-properties
		fo:font-family="Helvetica"
		style:font-family-generic="swiss"
		style:font-pitch="variable"/>
</style:style>
Following the style is the <office:body>, with an <office:drawing> element as its only child. The <office:drawing>’s first child is a <draw:page> element like this:
<draw:page draw:name="page1" draw:style-name="dp1"
    draw:master-page-name="Default">
This element contains the specifications for all the graphic objects drawn on the page.
Although the line is the simplest of the geometric figures, this explanation will be fairly lengthy, because we are defining our terms. Example 6.3, “Simple Horizontal Line” shows the <draw:line> elements for a horizontal line. The draw:style-name links this line with its style. The draw:layer attribute tells which workspace this line belongs to. The svg:x1, svg:y1, svg:x2, and svg:y2 attributes define the beginning and ending points of the line as length specifiers. The <draw:text-style-name> attribute isn’t used in this example.
Example 6.3. Simple Horizontal Line
<draw:line draw:style-name="gr1"
    draw:layer="layout"
    svg:x1="1.905cm" svg:y1="1.429cm"
    svg:x2="9.155cm" svg:y2="1.429cm"
    draw:text-style-name="P1"/>
That’s all you need to define any sort of ordinary line; the different types of lines (arrows, colors, line style and width) are all handled in the style that is referenced by draw:style-name
Example 6.4, “Style for a Simple Line” shows the style for the preceding line. All it does is reference the default style and add two attributes that refer to text (which we will discuss in the section called “Attaching Text to a Line”).
Example 6.4. Style for a Simple Line
<style:style style:name="gr1" style:family="graphic"
  style:parent-style-name="standard">
    <style:graphic-properties
      draw:textarea-horizontal-align="center"
      draw:textarea-vertical-align="middle"/>
</style:style>
To change the thickness of a line, add an svg:stroke-width attribute to the <style:graphic-properties>. This attribute is given as a number followed by a length specification, such as 0.12cm. The line’s color is controlled by the svg:stroke-color, given as a six-digit hexadecimal value such as #ff0000.
To make a dashed line, you add a draw:stroke-dash attribute; its value is the value of a <draw:stroke-dash> element which resides in the styles.xml file. Example 6.5, “Non-continuous Line” shows the XML for one of the standard dashed lines.
Example 6.5. Non-continuous Line
<draw:stroke-dash draw:name="Ultrafine_20_Dashed"
   draw:display-name="Ultrafine Dashed"
   draw:style="rect"
   draw:dots1="1" draw:dots1-length="0.051cm"
   draw:dots2="1" draw:dots2-length="0.051cm"
   draw:distance="0.051cm"/>
A dashed line is composed of alternating sequences of dots. draw:dots1 and draw:dots1-length give the number of dots and the length of the first sequence.[7] draw:dots2 and draw:dots2-length give the number of dots and length of the second sequence, and draw:distance gives the distance between the sequences. Finally, the draw:style tells whether the points of the dots and dashes are rect (square) or round, although, frankly, it’s hard to tell the difference.
To add arrows to the beginning of a line, you use the draw:marker-start and draw:marker-start-width attributes. (A similar pair of draw:marker-end and draw:marker-end-width attributes define the arrow at the end of a line.)
The <draw:marker-start> and <draw:marker-end> elements refer to a <draw:marker> element. The markers for the standard arrows from OpenOffice.org are in the styles.xml file, and the names are: Arrow, Arrow_20_concave, Circle, Dimension_20_Lines, Double_20_Arrow, Line_20_Arrow, Rounded_20_large_20_Arrow, Rounded_20_short_20_Arrow, Small_20_Arrow, Square_20_45, and Symmetric_20_Arrow.
Example 6.6, “Double Arrow Marker” shows the XML for the double arrow marker. If you don’t intend to create your own arrowhead definitions, you may skip this example and its following explanation.
Example 6.6. Double Arrow Marker
<draw:marker draw:name="Double_20_Arrow"
    svg:viewBox="0 0 1131 1918"
    svg:d="m737 1131 h394 l-564-1131 -567 1131 h398 l-398 787 h1131 z"/>
To be very brief, the svg:viewBox attribute sets the coordinate system for the marker, and the svg:d attribute defines the outline of the marker, as it would be described in an SVG <path> element. We’ll discuss this attribute further in the section called “Polylines, Polygons, and Free Form Curves”.
OpenDocument lets you specify "measure lines" which automagically show the line’s width, as in Figure 6.1, “Measure Line for a Horizontal Line”
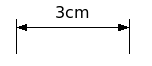
Example 6.7, “XML for a Measure Line” shows the XML for the measure line in Figure 6.1, “Measure Line for a Horizontal Line”. Note that the measure line belongs to the measurelines layer, not the normal layout layer.
Example 6.7. XML for a Measure Line
<draw:measure draw:style-name="gr10"
  draw:text-style-name="P2"
  draw:layer="measurelines"
  svg:x1="10.901cm" svg:y1="4.656cm"
  svg:x2="13.901cm" svg:y2="4.656cm">
    <text:p text:style-name="P2">
        <text:measure text:kind="gap"/>
        <text:measure text:kind="value">3</text:measure>
        <text:measure text:kind="unit">cm</text:measure>
        <text:measure text:kind="gap"/>
    </text:p>
</draw:measure>
There are times you want text to be “attached” to the line as a label so that moving the line moves the text along with it. Figure 6.2, “Arrow Labelled with Text” shows just such an arrow.[8]
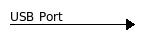
Example 6.8, “XML for Labelled Arrow” shows the XML for the preceding figure.
Example 6.8. XML for Labelled Arrow
<draw:line draw:style-name="gr11"
  draw:text-style-name="P4"
  draw:layer="layout"
  svg:x1="2.858cm" svg:y1="1.852cm"
  svg:x2="6.165cm" svg:y2="1.852cm">
    <text:p text:style-name="P3">
        <text:span text:style-name="T1">USB Port</text:span>
    </text:p>
</draw:line>
As you may have suspected, the styles contain all the important information. Example 6.9, “Styles for Labelled Line” shows all the styles referenced in the preceding example.
Example 6.9. Styles for Labelled Line
<style:style style:name="gr11" style:family="graphic"
style:parent-style-name="standard">
<style:graphic-properties draw:marker-end="Symmetric_20_Arrow"
draw:textarea-horizontal-align="left"  draw:textarea-vertical-align="bottom"
fo:padding-top="0cm"
fo:padding-bottom="0.1cm"
fo:padding-left="0cm"/>
</style:style>
<style:style style:name="P4" style:family="paragraph">
draw:textarea-vertical-align="bottom"
fo:padding-top="0cm"
fo:padding-bottom="0.1cm"
fo:padding-left="0cm"/>
</style:style>
<style:style style:name="P4" style:family="paragraph">  <style:paragraph-properties fo:text-align="start"/>
<style:text-properties
fo:font-family="'Bitstream Vera Sans'"
style:font-pitch="variable" fo:font-size="9pt"/>
</style:style>
<style:style style:name="P3" style:family="paragraph">
<style:paragraph-properties
fo:margin-left="0cm" fo:margin-right="0cm"
fo:text-align="start" fo:text-indent="0cm"/>
<style:text-properties
fo:font-family="'Bitstream Vera Sans'"
style:font-pitch="variable" fo:font-size="9pt"/>
</style:style>
<style:style style:name="T1" style:family="text">
<style:paragraph-properties fo:text-align="start"/>
<style:text-properties
fo:font-family="'Bitstream Vera Sans'"
style:font-pitch="variable" fo:font-size="9pt"/>
</style:style>
<style:style style:name="P3" style:family="paragraph">
<style:paragraph-properties
fo:margin-left="0cm" fo:margin-right="0cm"
fo:text-align="start" fo:text-indent="0cm"/>
<style:text-properties
fo:font-family="'Bitstream Vera Sans'"
style:font-pitch="variable" fo:font-size="9pt"/>
</style:style>
<style:style style:name="T1" style:family="text">  <style:text-properties
fo:font-family="'Bitstream Vera Sans'"
style:font-pitch="variable" fo:font-size="9pt"/>
</style:style>
<style:text-properties
fo:font-family="'Bitstream Vera Sans'"
style:font-pitch="variable" fo:font-size="9pt"/>
</style:style>
| | draw:textarea-horizontal-align and draw:textarea-vertical-align place the text in relation to the area occupied by the line or arrow. The horizontal align can have values left, center, and right. The vertical align can have values top, middle, and bottom. The fo:padding-side attributes position the text relative to the line. |
| | This style combines the attributes of the following two styles; if you are creating a document programmatically, you don’t have to create this style or reference it in the <draw:line> element. |
| | This style is necessary to set the font size properly. |
Let’s move on to two-dimensional objects: rectangles and squares, ellipses, circles, and arcs. Before looking at the individual shapes, it is necessary to discuss the style information they share.
Two-dimensional objects have an outline and an interior, so their styles contain information about the lines that make up the outline and about the method used to fill the object’s interior.
The styles for the outline are exactly the ones described in the section called “Line Attributes”. The interior style is specified with the draw:fill attribute, which may have a value of none, solid, gradient, hatch, or bitmap. If you want an unfilled object, you must specify none. If you leave off this attribute, the object will be filled with the default color (which is set in the <style:style style:name="standard" style:famliy="graphic"> element in styles.xml).
Solid fills are the easiest; in addition to the specification of draw:fill="solid", you specify the draw:fill-color attribute as a six-digit hexadecimal value. Example 6.10, “Solid Fill Style” shows the XML for a style which will draw objects with a 0.1 centimeter red border and a solid light blue fill.
To fill an area with a gradient, set the draw:fill attribute to gradient, and set the draw:fill-gradient-name attribute to refer to a <draw:gradient> element in the styles.xml file.[9]
The <draw:gradient> element will have the corresponding draw:name attribute (with hex characters encoded as _xx_), a draw:display-name, and a draw:style attribute that specifies the gradient type: linear (from edge to edge), axial (from center outwards), radial (circular), ellipsoid, square, and rectangular.
All gradients have a draw:start-color and draw:end-color attribute. You may specify their intensity with the draw:start-intensity and draw:end-intensity attributes, each of which has values ranging from 0% to 100%; the default is 100%.
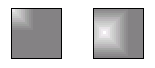
All gradients also have a draw:border attribute, again expressed as a percentage, which is used to scale a border which is filled by the start or end color only. The default is 0%. Figure 6.3, “Effect of Border on Gradients” shows two radial gradient fills. The gradient on the left has no border; the gradient on the right has a border of 50%.
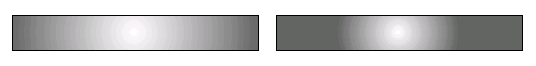
All gradients may specify a draw:angle attribute that rotates the gradient. Figure 6.4, “Effect of Angle on Gradients” shows two axial gradients; the one on the left has an angle of zero, and the one on the right has an angle of 30 degrees. Angles are measured counterclockwise from 0 degrees, which is at the ”three o’clock” position. The value is expressed in tenths of a degree, so the value for the rotated gradient would be 300. The default value is zero. In the case of a radial gradient, this attribute has no effect, since circles look alike at every angle.
Finally, for all gradients except linear and axial, you may specify the center x and y coordinate where the gradient starts. The draw:cx and draw:cy attributes have values ranging from 0% to 100%. Figure 6.5, “Effect of Center Coordinates on Gradients” shows a rectangular gradient with a center x and y of 0% on the left, and a center x of 25% and center y of 50% on the right.
Example 6.11, “XML Representation of Gradients” shows the XML for the gradients in the preceding figures. The intensity attributes have been removed to save space.
Example 6.11. XML Representation of Gradients
<!-- radial gradient, light gray to white, centered, 0% border -->
<draw:gradient draw:name="radial_20_borderless"
    draw:display-name="radial borderless"
    draw:style="radial"
    draw:cx="50%" draw:cy="50%"
    draw:start-color="#999999" draw:end-color="#ffffff"
    draw:border="0%"/>

 <!-- radial gradient, gray to white, centered, 50% border -->
 <draw:gradient draw:name="radial_20_bordered"
    draw:display-name="radial bordered"
    draw:style="radial"
    draw:cx="50%" draw:cy="50%"
    draw:start-color="#666666" draw:end-color="#ffffff"
    draw:start-intensity="100%" draw:end-intensity="100%" draw:border="50%"/

<!-- axial gradient, black to white, 30% border -->
<draw:gradient draw:name="axial_20_black_20_to_20_white"
    draw:display-name="axial black to white"
    draw:style="axial"
    draw:start-color="#000000" draw:end-color="#ffffff"
    draw:angle="0" draw:border="30%"/>

<!-- axial gradient, black to white, 30% border, rotated 30 degrees -->
<draw:gradient draw:name="axial_20_30_20_degree_20_black_20_to_20_white"
    draw:display-name="axial 30 degree black to white"
    draw:style="axial"
    draw:start-color="#000000" draw:end-color="#ffffff"
    draw:angle="300" draw:border="30%"/>

<!-- rectangular gradient, gray to white, centered at top left -->
<draw:gradient draw:name="rectangular_20_0_20_0"
    draw:display-name="rectangular 0 0"
    draw:style="rectangular"
    draw:cx="0%" draw:cy="0%"
    draw:start-color="#808080" draw:end-color="#ffffff"
    draw:angle="0" draw:border="0%"/>

<!-- rectangular gradient, gray to white, centered at (25%, 50%) -->
<draw:gradient draw:name="rectangular_20_25_20_50"
    draw:display-name="rectangular 25 50"
    draw:style="rectangular"
    draw:cx="25%" draw:cy="50%"
    draw:start-color="#808080" draw:end-color="#ffffff"
    draw:angle="0" draw:border="0%"/>
Compared to gradients, hatch fills are simplicity itself. To fill an object with a hatch, set the object’s draw:fill attribute to hatch, and set the draw:fill-hatch-name attribute to refer to a <draw:hatch> element in the styles.xml file.
Within a <draw:hatch> element, specify these attributes in addition to the draw:name and draw:display-name.
- draw:style
- Number of lines in the hatch: single, double (lines at right angles), or triple (lines at right angles, with one diagonal).
- draw:color
- The hatching color, as a six-digit hex value.
- draw:distance
- The spacing between hatch lines, in a form such as 0.18cm.
- draw:rotation
- A number in tenths of a degree; thus a 45 degree rotation has a value of 450.
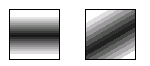
Example 6.12, “XML for Hatch Fill” shows the XML for a widely-spaced, deep red, single-line hatch at a 45 degree angle.
Example 6.12. XML for Hatch Fill
<draw:hatch draw:name="Red_20_Diagonal"
    draw:display-name="Red Diagonal"
    draw:style="single"
    draw:color="#800000"
    draw:distance="0.18cm"
    draw:rotation="450"/>
If you want a background color to fill the spaces between the hatch lines, then set the object’s draw:fill-color as well as its draw:fill-hatch attribute.
To fill an object with a bitmap image, set the object’s draw:fill attribute to bitmap, and set the draw:fill-image-name attribute to refer to a <draw:fill-image> element in the styles.xml file.
Within a <draw:fill-image> element, you have the standard draw:name attribute and draw:display-name plus:
- xlink:href
- A reference to the image file; it begins with #Pictures/ and is followed by the internal file name. The file is stored in the Pictures directory.
- xlink:type, xlink:show, xlink:actuate
- These three items always have the values simple (for xlink:type), embed (for xlink:show), and onLoad (for xlink:actuate).
Example 6.13, “XML for Bitmap Fill” shows the XML for a bitmap fill.
You may give any object a drop shadow by specifying the following attributes:
- draw:shadow
- The value should be set to visible
- draw:shadow-color
- The shadow color, expressed as a six-digit hex value.
- draw:shadow-opacity
- The value ranges from 0% (transparent) to 100% (completely opaque).
- draw:shadow-offset-x, draw:shadow-offset-y
- The distance from the upper left corner of the object to the upper left corner of the shadow, specified in centimeters. Negative numbers are left and upwards of the object.
Now that we know how to outline and fill an object, let’s find out how to draw objects. The simplest object of all is a rectangle, expressed with the <draw:rect> element. You define a rectangle by the coordinates of its upper left corner, (svg:x and svg:y) and its width and height (svg:width and svg:height). As with lines, rectangles will have a draw:layer of layout. Finally, a draw:style-name attribute will define the fill and outline style for the rectangle. You can see all of this put together in Example 6.14, “XML for a Rectangle”.[10]
Example 6.14. XML for a Rectangle
 <draw:rect draw:layer="layout"
    svg:x="2.105cm" svg:y="2.225cm"
    svg:width="2.827cm" svg:height="1.203cm"
    draw:style-name="gr1"/>
You may draw a rounded rectangle by specifying a draw:corner-radius attribute with a length as its value, such as 0.5cm.
To draw a circle or an ellipse, use a <draw:circle> or <draw:ellipse> element. The attributes of this tag are exactly the same as those for a rectangle. Instead of drawing a rectangle, the svg:x, svg:y, svg:width, and svg:height define the bounding box of the circle or ellipse. In other words, the circle or ellipse is inscribed in the rectangle that you have specified. Example 6.15, “XML for Circle and Ellipse” shows the XML for a circle and an ellipse.
Example 6.15. XML for Circle and Ellipse
<draw:circle draw:style-name="gr2"
    draw:text-style-name="P1" draw:layer="layout"
    svg:x="5.533cm" svg:y="1.984cm"
    svg:width="1.745cm" svg:height="1.745cm"/>

<draw:ellipse draw:style-name="gr1"
    draw:text-style-name="P1" draw:layer="layout"
    svg:x="1.504cm" svg:y="2.044cm"
    svg:width="2.466cm" svg:height="1.445cm"/>
You may also draw elliptical and circular arcs and segments. For all of these, you must specify the draw:start-angle and draw:end-angle attributes in degrees. The draw:kind attribute tells what part of the ellipse you are drawing: section for a pie-shaped slice, cut for a chord cut across the ellipse or circle, and arc for an unfilled arc. Example 6.16, “XML for Arcs and Segments” shows an example of each of these.
Example 6.16. XML for Arcs and Segments
<!-- elliptical pie slice -->
<draw:ellipse draw:style-name="gr2"
    draw:layer="layout"
    svg:width="1.932cm" svg:height="1.482cm"
    svg:x="4.842cm" svg:y="2.275cm"
    draw:kind="section"
    draw:start-angle="319.5" draw:end-angle="71.09/">

<!-- circle segment -->
<draw:circle draw:style-name="gr3"
    draw:layer="layout"
    svg:width="1.587cm" svg:height="1.587cm"
    svg:x="7.938cm" svg:y="1.218cm"
    draw:kind="cut"
    draw:start-angle="255.47" draw:end-angle="40.23"/>

<!-- elliptical arc -->
<draw:ellipse draw:style-name="gr1"
    draw:layer="layout"
    svg:width="1.958cm" svg:height="1.402cm"
    svg:x="2.117cm" svg:y="1.588cm"
    draw:kind="arc"
    draw:start-angle="360" draw:end-angle="70.25"/>
If you want anything other than a basic shape, you have to use a polyline, polygon, or free-form curve. For all of these, you must establish a bounding box and a coordinate system. The bounding box is a rectangle which entirely contains the object, and is specified with svg:x, svg:y, svg:width, and svg:height attributes. all measured in centimeters.
The coordinate system is established with the svg:viewBox attribute which has four numbers: the minimum x-coordinate, minimum x-coordinate, width, and height of the coordinate system. In OpenDocument, the minimum coordinates are zero, and the width and height are set to the width and height of the bounding box times 1000. Thus, a coordinate of (250, 1602) will be 0.25 centimeters from the left corner of the bounding box and 1.602 centimeters from the top of the bounding box.
A polyline is simply a series of connected straight lines. Their coordinates are described as pairs of x,y coordinates separated by whitespace. The polyline shown in Figure 6.6, “Simple Polyline” has the XML representation in Example 6.17, “XML for a Polyline”.
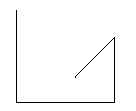
Example 6.17. XML for a Polyline
<draw:polyline draw:style-name="gr1" draw:layer="layout"
    svg:x="8.335cm" svg:y="4.948cm"
    svg:width="2.593cm" svg:height="2.434cm"
    svg:viewBox="0 0 2594 2435"
    draw:points="0,0 0,2434 2593,2434 2593,714 1561,1746 1561,1773"/>
Polygons use the <draw:polygon> element, which has exactly the same attributes as <draw:polyline>. You do not have to close the polygon by repeating the first coordinate at the end of the draw:points attribute; the application will automatically close the figure for you when it draws the polygon.
OpenOffice.org’s Coordinate System
OpenOffice.org does not allow you to set an arbitrary coordinate system; it sets the coordinate system to one thousand units per centimeter. All x- and y- positions, widths, and heights are measured in centimeters, independent of the “unit of measurement” setting.
For all other curves (Bézier curves and freeform drawing), OpenDocument uses a <draw:path> element, which is modeled after the SVG <path> element. The svg:d attribute describes the path data, and has a value consisting of command letters and coordinates. For example, the M command moves the pen to the given x- and y-coordinates. L draws a line to the given coordinates, and Z is the command for closing a polygon. Thus, the path data for a trapezoid would look like this:
svg:d="M 300 0 L 700 0 L 1000 1000 L 0 1000 Z"
Lowercase letters take relative coordinates (relative to the last point drawn). Thus, the preceding trapezoid, expressed in relative coordinates, is:
svg:d="m 300 0 l 400 0 l 300 1000 l -1000 0 z"
In the preceding example, the first coordinate is relative to (0,0), the upper left of the bounding box. If you eliminate duplicated commands and unnecessary whitespace, the preceding examples can be reduced to:[11]
svg:d="M300 0L700 0 1000 1000 0 1000Z"
svg:d="m300 0l400 0 300 1000-1000 0z"
Table 6.1, “Path Commands” summarizes the path commands available in OpenDocument. This table is taken from SVG Essentials, published by O’Reilly & Associates. When creating paths, uppercase commands use absolute coordinates and lowercase commands use relative coordinates. Some applications may support only a subset of these commands.
Table 6.1. Path Commands
| Command | Arguments | Effect |
|---|---|---|
M m | x y | Move to given coordinates. |
L l | x y | Draw a line to the given coordinates. You may supply multiple sets of coordinates to draw a polyline. |
H h | x | Draw a horizontal line to the given x-coordinate. |
V v | y | Draw a vertical line to the given y-coordinate. |
A a | rx ry x-axis-rotation large-arc sweep x y | Draw an elliptical arc from the current point to (x, y). The points are on an ellipse with x-radius rx and y-radius ry. The ellipse is rotated x-axis-rotation degrees. If the arc is less than 180 degrees, large-arc is zero; if greater than 180 degrees, large-arc is one. If the arc is to be drawn in the positive direction, sweep is one; otherwise it is zero. |
Q q | x1 y1 x y | Draw a quadratic Bézier curve from the current point to (x, y) using control point (x1, y1). |
T t | x y | Draw a quadratic Bézier curve from the current point to (x, y). The control point will be the reflection of the previous Q command's control point. If there is no previous curve, the current point will be used as the control point. |
C c | x1 y1 x2 y2 x y | Draw a cubic Bézier curve from the current point to (x, y) using control point (x1, y1) as the control point for the beginning of the curve and (x2, y2) as the control point for the endpoint of the curve. |
S s | x2 y2 x y | Draw a cubic Bézier curve from the current point to (x, y), using (x2, y2) as the control point for this new endpoint. The first control point will be the reflection of the previous C command's ending control point. If there is no previous curve, the current point will be used as the first control point. |
Warning
OpenOffice.org does not support the arc path commands A and a
Text in a graphic is contained in a <draw:frame> element. the drawing style. As with other objects, it has a draw:layer of layout and sets the location and dimensions with svg:x, svg:y, svg:width, and svg:height. The <draw:frame> also contains a draw:style-name attribute that refers to a style:style element in the content.xml file. This <style:style> contains a <style:graphic-properties> element that sets
- draw:stroke
- svg:stroke-color
- draw:fill
- draw:fill-color
- draw:textarea-vertical-align (top, middle, or bottom)
- draw:textarea-horizontal-align (left, right, center, or justify)
- draw:writing-mode (set to tb-rl for vertical text; omit it for horizontal text)
You may specify how the text area grows to fit the text with the draw:auto-grow-height and draw:auto-grow-width attributes, which take values of true and false.
Within the <draw:frame> is a <draw:text-box> element, which contains one or more <text:p> elements that describe the actual text. Example 6.18, “Simple Text Box” shows the XML fragments for a simple text area that displays the words Hello, text. on a peach-colored background with a purple border.
Example 6.18. Simple Text Box
<!-- within office:automatic-styles section -->
<style:style style:name="gr1" style:family="graphic"
style:parent-style-name="standard">
<style:graphic-properties
svg:stroke-width="0.051cm" svg:stroke-color="#800080"
draw:marker-start-width="0.381cm" draw:marker-end-width="0.381cm"
draw:fill="solid" draw:fill-color="#ffcc99"
draw:textarea-horizontal-align="left"
draw:auto-grow-height="true" draw:auto-grow-width="true"
fo:min-height="0cm" fo:min-width="0cm"
fo:padding-top="0.15cm" fo:padding-bottom="0.15cm" fo:padding-left="0.275cm" fo:padding-right="0.275cm"/>
</style:style>
<!-- within document body -->
<draw:frame draw:style-name="gr1" draw:text-style-name="P1"
draw:layer="layout"
svg:x="2.3cm" svg:y="2.25cm"
svg:width="4.05cm" svg:height="1.04cm">
<draw:text-box>
<text:p text:style-name="P1">Hello, text.</text:p>
</draw:text-box>
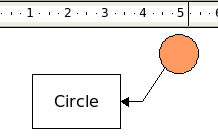
</draw:frame>A callout is implemented via a <draw:caption> element. In addition to all the attributes of the draw:frame element, it specifies the endpoint of the callout line with the draw:caption-point-x and draw:caption-point-y attributes. Their values are relative to the upper left corner of the callout’s bounding box. Example 6.19, “XML for Callout Text” shows the style and body XML for the callout depicted in Figure 6.7, “Callout Text in a Drawing”. (Just the callout, not the circle.) The arrow is considered to be the draw:marker-end.
Example 6.19. XML for Callout Text
<!-- style information -->
<style:style style:name="gr2" style:family="graphic"
  style:parent-style-name="standard">
    <style:graphic-properties
        draw:marker-start=""
        draw:marker-end="Symmetric_20_Arrow"
        draw:fill="none" draw:fill-color="#ffffff"
        draw:textarea-horizontal-align="justify" draw:textarea-vertical-align="middle"
        draw:auto-grow-height="true" draw:auto-grow-width="true"
        fo:min-height="1.238cm" fo:min-width="2.128cm"
        fo:padding-top="0.1cm" fo:padding-bottom="0.1cm"
        fo:padding-left="0.1cm" fo:padding-right="0.1cm"/>
</style:style>

<!-- body information -->
<draw:caption draw:style-name="gr2" draw:text-style-name="P3"
  draw:layer="layout"
  svg:x="1.907cm" svg:y="2.594cm"
  svg:width="2.328cm" svg:height="1.438cm"
  draw:caption-point-x="3.491cm" draw:caption-point-y="-0.158cm">
    <text:p text:style-name="P3">
        <text:span text:style-name="T1">Circle</text:span>
    </text:p>
</draw:caption>
A rotated object in an OpenDocument drawing has a draw:transform attribute in the element that describes that object. The value of this attribute is a whitespace-separated list of mathematical functions to be performed on the object. These transformations include:
- rotate( )
- The argument to this function is the number of radians to rotate, not degrees, as in SVG. To convert from degrees to radians, multiply by pi (3.141592653...) and divide by 180. The object is rotated about its pivot point, which is normally the object’s geometric center. Angles are measured with zero at the “three o’clock” position, increasing in a counterclockwise direction.
- translate( )
- This function moves the object to the specified location, given as two lengths separated by whitespace, as in translate(1cm 1.3cm).
- skewX( ), skewY( )
- These functions take a single argument, given in radians, which tells how to slant the object in the x-direction or y-direction.
- scale( )
- This function takes two arguments: the factor by which to scale all x-coordinates and the factor by which to scale all y-coordinates. If you give only one argument, then both x- and y-coordinates will be scaled by this factor.
It is possible to have a series of transformations separated by whitespace. The order of transformations is important. When you rotate an object in a drawing, the application will often generate a rotate followed by a translate in order to position the object properly.
We now have enough information to create a drawing from scratch. We will use XSLT to create an OpenDocument drawing from data in the Weather Observation Markup Format (OMF), defined at http://zowie.metnet.navy.mil/~spawar/JMV-TNG/XML/OMF.html. OMF is, for the most part, a wrapper for several different types of weather reports. The OMF elements add annotation, decoded information, and quantities calculated from the raw reports. Here is a sample report:
<Reports TStamp="997568716">
<SYN Title='AAXX' TStamp='997573600' LatLon='37.567, 126.967' BId='471080'
SName='RKSL, SEOUL' Elev='86'>
<SYID>47108</SYID>
<SYG T='22.5' TD='14.1' P='1004.1' P0='1014.1' Pd='0 0.1' Vis='22000'
Ceiling='INF' Wind='30-70, 1.5' WX='NOSIG' Prec=' ' Clouds='44070'>
32972 40703 10225 20141 30041 40141 50001 84070
</SYG></SYN>
</Reports>
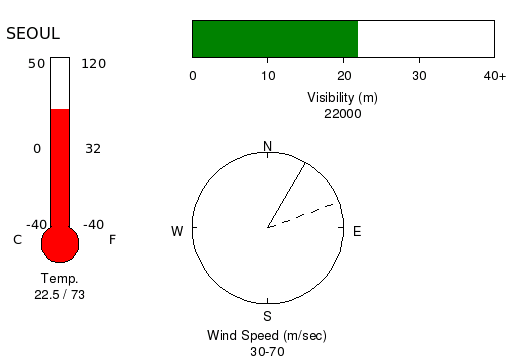
Our objective is to extract the reporting station, the date and time, temperature, wind speed and direction, and visibility from the report. These data will be filled into the graphic template of Figure 6.8, “Graphic weather template”
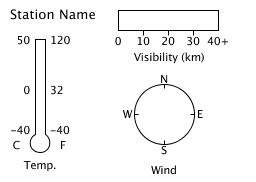
The OMF format attributes that we’re interested in are listed here, along with the plan for displaying them in the final graphic. The first two required attributes come from the <SYN> element, the rest are optional attributes from its child <SYG> element.
- SName
The reporting station’s call letters, possibly followed by a comma and the station’s full name. The final graphic will represent this as text.
- T
The air temperature in degrees Celsius. This will be displayed by coloring in the thermometer to the appropriate level. If the temperature is greater than zero, then the coloring will be red; if less than or equal to zero, then it will be blue.
- Wind
A direction and speed, separated by a comma. The direction is measured in degrees; 0 indicates wind blowing from true north, and 270 indicates wind from the west. This will be represented by a line on the compass.
Wind direction may also be expressed as two numbers separated by a dash, indicating a range of directions. Thus, 0-40 indicates wind from the north to north-east. In this case, two dashed lines will be drawn on the compass.
The wind speed is expressed in meters per second. If two numbers are given, separated by a dash, the second number indicates the speed of gusts of wind. This information will be displayed in text form.
- Vis
Surface visibility in meters, or the value INF for unlimited visibility. The final graphic will represent this by filling in a horizontal bar. Any visibility above forty kilometers will be presumed to be unlimited.
Let us first examine the styles we will need for this drawing:
- A solid line. We will use this line for the outlines of the thermometer, wind, and visibility meters. It will also be used for the direction line of the wind.
- A dashed line. We will use this if there is more than one direction line for the wind.
- A red fill with no outline, used for temperatures greater than zero.
- A blue fill with no outline, used for temperatures less than or equal to zero.
- A green fill with no outline, used to fill the visibility meter.
- A graphics style for text with no outline and no fill
- Ten-point text styles for the small text; left-aligned, centered, and right-aligned
- A twelve-point text style for the larger text.
This gives us enough to start our stylesheet. [The full transformation is file weather.xsl in directory ch06 in the downloadable example files.] We start out with the root element and its namespace declarations.
<?xml version="1.0" encoding="UTF-8"?>
<xsl:stylesheet version="1.0"
    xmlns:xsl="http://www.w3.org/1999/XSL/Transform"
    xmlns:office="urn:oasis:names:tc:opendocument:xmlns:office:1.0"
    xmlns:text="urn:oasis:names:tc:opendocument:xmlns:text:1.0"
    xmlns:table="urn:oasis:names:tc:opendocument:xmlns:table:1.0"
    xmlns:draw="urn:oasis:names:tc:opendocument:xmlns:drawing:1.0"
    xmlns:style="urn:oasis:names:tc:opendocument:xmlns:style:1.0"
    xmlns:fo="urn:oasis:names:tc:opendocument:xmlns:xsl-fo-compatible:1.0"
    xmlns:svg="urn:oasis:names:tc:opendocument:xmlns:svg-compatible:1.0"

    xmlns:label="urn:evc-cit.info:examples:internal-use-only"
>
Whoa! That last namespace isn’t one that you have seen before. We’re going to insert some custom elements of our own into this stylesheet to make it easier to put labels on the graphics. These elements will need a namespace, so we have made up a prefix (label) and a URI for them (urn:evc-cit.info:examples:internal-use-only). A URI just needs to be unique; it doesn’t have to point to anything on the web—and in this case, we don’t want it to.
Now, on to the rest of the setup:
<xsl:output method="xml" indent="yes"/>

<xsl:template match="/">
<office:document-content
    xmlns:office="urn:oasis:names:tc:opendocument:xmlns:office:1.0"
    xmlns:style="urn:oasis:names:tc:opendocument:xmlns:style:1.0"
    xmlns:text="urn:oasis:names:tc:opendocument:xmlns:text:1.0"
    xmlns:table="urn:oasis:names:tc:opendocument:xmlns:table:1.0"
    xmlns:draw="urn:oasis:names:tc:opendocument:xmlns:drawing:1.0"
    xmlns:fo="urn:oasis:names:tc:opendocument:xmlns:xsl-fo-compatible:1.0"
    xmlns:svg="urn:oasis:names:tc:opendocument:xmlns:svg-compatible:1.0"
    office:version="1.0">
<office:scripts/>

<office:automatic-styles>
    <style:style style:name="dp1" style:family="drawing-page"/>

    <style:style style:name="solidLine" style:family="graphic"
     style:parent-style-name="standard">
        <style:graphic-properties
            svg:stroke-color="#000000"
            draw:fill="none"/>
    </style:style>

    <draw:stroke-dash draw:name="3 by 3" draw:style="rect"
        draw:dots1="3" draw:dots1-length="0.203cm"
        draw:dots2="3" draw:dots2-length="0.203cm"
        draw:distance="0.203cm"/>

    <style:style style:name="dashLine" style:family="graphic"
     style:parent-style-name="standard">
        <style:graphic-properties
            draw:stroke="dash" draw:stroke-dash="3 by 3"
            svg:stroke-color="#000000"
            draw:fill="none"/>
    </style:style>

    <style:style style:name="redfill" style:family="graphic"
     style:parent-style-name="standard">
        <style:graphic-properties draw:stroke="none"
            draw:fill="solid" draw:fill-color="#ff0000"/>
    </style:style>

    <style:style style:name="bluefill" style:family="graphic"
     style:parent-style-name="standard">
        <style:graphic-properties draw:stroke="none"
            draw:fill="solid" draw:fill-color="#0000ff"/>
    </style:style>

    <style:style style:name="greenfill" style:family="graphic"
     style:parent-style-name="standard">
        <style:graphic-properties draw:stroke="none"
            draw:fill="solid" draw:fill-color="#008000"/>
    </style:style>

    <style:style style:name="textgraphics" style:family="graphic"
      style:parent-style-name="standard">
        <style:graphic-properties draw:stroke="none" draw:fill="none"
            draw:auto-grow-width="true" draw:auto-grow-height="true"/>
    </style:style>

    <style:style style:name="smallLeft" style:family="paragraph">
        <style:text-properties
            fo:font-size="10pt"
            fo:font-family="Bitstream Vera Sans"/>
    </style:style>

    <style:style style:name="smallRight" style:family="paragraph">
        <style:paragraph-properties fo:text-align="end"/>
        <style:text-properties
            fo:font-size="10pt"
            fo:font-family="Bitstream Vera Sans"/>
    </style:style>

    <style:style style:name="smallCenter" style:family="paragraph">
        <style:paragraph-properties fo:text-align="center"/>
        <style:text-properties
            fo:font-size="10pt"
            fo:font-family="Bitsream Vera Sans"/>
    </style:style>

    <style:style style:name="largetext" style:family="paragraph">
        <style:text-properties
            fo:font-size="12pt"
            fo:font-family="Bitstream Vera Sans"/>
    </style:style>

</office:automatic-styles>

<office:body>
    <office:drawing>
        <draw:page draw:name="page1" draw:style-name="dp1"
            draw:master-page-name="Default">
            <xsl:apply-templates select="Reports"/>
        </draw:page>
    </office:drawing>
</office:body>
</office:document-content>
</xsl:template>

<!-- other templates go here -->
</xsl:stylesheet>
To make things modular (and to keep our sanity), we will handle the four objects in separate templates, from easiest to most difficult.
<xsl:template match="Reports">
    <xsl:apply-template select="SYN/@SName"/>
    <xsl:apply-template select="SYN/SYG/@Vis"/>
    <xsl:apply-template select="SYN/SYG/@Wind"/>
    <xsl:apply-template select="SYN/SYG/@T"/>
</xsl:template>
The station name is pure text which goes into a <draw:text-box> element (within a <draw:frame>). We don’t want the station abbreviation, so we will use just the part that follows the comma and blank. We must set both the svg:width and svg:height to display the text properly, even though we have set auto-grow-width and auto-grow-height to true in the style. A little math tells us that one point is 0.0353 centimeters, so a height of one-half centimeter will easily accommodate a twelve-point font. To calculate the width, we will multiply the number of characters by twelve (the point size) and convert that to centimeters. This will be longer than we need, since not all characters will have maximum width. Here’s the resulting template.
<xsl:template match="@SName">
    <xsl:variable name="shortName"
        select="substring-after(., ', ')"/>
    <xsl:variable name="nameWidth"
        select="(string-length($shortName) * 12) * 0.0353"/>

<draw:frame
    draw:style-name="textgraphics"
    draw:layer="layout"
    svg:x="0.75cm" svg:y="2cm"
    svg:width="{$nameWidth}cm" svg:height=".5cm">
    <draw:text-box>
    <text:p text:style-name="largetext"><xsl:value-of
        select="$shortName"/></text:p>
    </draw:text-box>
</draw:frame>
</xsl:template>
On to the visibility bar. To make the math easy, we’ll make the bar eight centimeters wide and one centimeter tall.
<xsl:template match="@Vis"> <!-- calculate the number of centimeters to fill --> <xsl:variable name="visWidth"><xsl:for-each select="document('')/*/label:visibility/label:text"> <draw:frame draw:style-name="textgraphics" draw:layer="layout" svg:y="3.125cm" svg:width="0.8cm" svg:height=".5cm"> <xsl:attribute name="svg:x"> <xsl:value-of select="@x + 5.625"/> <xsl:text>cm</xsl:text> </xsl:attribute> <draw:text-box> <text:p text:style-name="smallCenter"><xsl:value-of select="."/></text:p> </draw:text-box> </draw:frame> </xsl:for-each> <draw:frame draw:style-name="textgraphics"
draw:layer="layout" svg:x="6cm" svg:y="3.7cm" svg:height="1cm" svg:width="8cm"> <draw:text-box> <text:p text:style-name="smallCenter">Visibility (m)</text:p> <text:p text:style-name="smallCenter"><xsl:value-of select="."/></text:p> </draw:text-box> </draw:frame> </xsl:template> <label:visibility>
<label:text x="0">0</label:text> <label:text x="2">10</label:text> <label:text x="4">20</label:text> <label:text x="6">30</label:text> <label:text x="8">40+</label:text> </label:visibility>
| | To prevent the filled area from overflowing the boundary, we have to test to see if we have the special value of INF (unlimited visibility) or a value greater than 40,000. If so, fill all eight centimeters of the bar. |
| | If object A’s XML comes before object B’s XML in the file, then object A is behind object B. Thus, we draw the filled-in area first. This guarantees that it will not obscure the outline of the visibility bar. |
| | We start the x-coordinate at 8 centimeters, where the first tick mark lies. This is because OpenOffice.org became cranky when we set the x-coordinate to 10 centimeters and started the path with m2000 0, insisting upon moving it back to (0,0). |
| |
Each of the numbers underneath the visibility bar requires a
<draw:frame> element. Each
of these elements has a large number of attributes, differing only
in the svg:x value. Copy-and-paste
will work, but if a modification of the drawing required a
change to one of the other attributes, we would have to change all
the elements.
What we will do is keep a table of the labels’ text and their offset from the starting x-position, and then use XSLT to process that table. This table will be stored in the form of elements with the label: namespace. In order to access this information, we use the XPath expression document('')/*/label:visibility/label:text. It will select all <label:text> elements within <label:visiblity> elements within this entire document (document('')/*). |
| | We finish the template with the words “Visibility (m)” and the visiblity value in a framed text box. |
| | Here are the labels and their offsets that the template uses. The offsets are in centimeters. |
We now move on to the wind compass; most of the complexity in this template lies in determining whether we need to draw one line or two within the compass.
<xsl:template match="@Wind">
<draw:circle draw:style-name="solidLine" draw:layer="layout"
    svg:x="6cm" svg:y="5.5cm"
    svg:width="4cm" svg:height="4cm"/>

<xsl:variable name="dir" select="substring-before(., ',')"/>
<xsl:variable name="dir1">
    <xsl:choose>
    <xsl:when test="contains($dir, '-')">
        <xsl:value-of select="90 - number(substring-before($dir, '-' ))"/>
    </xsl:when>
    <xsl:otherwise>
        <xsl:value-of select="90 - number($dir)"/>
    </xsl:otherwise>
    </xsl:choose>
</xsl:variable>

<xsl:variable name="dir2">
    <xsl:choose>
    <xsl:when test="contains($dir, '-')">
        <xsl:value-of select="90 - number(substring-after($dir, '-' ))"/>
    </xsl:when>
    <xsl:otherwise>
        <xsl:value-of select="90 - number($dir)"/>
    </xsl:otherwise>
    </xsl:choose>
</xsl:variable>

<draw:path
    draw:layer="layout"
    svg:viewBox="0 0 2000 100"
    svg:d="m 0 0 2000 0"
    svg:width="2cm" svg:height="0.1cm"
    svg:x="0cm" svg:y="0cm"
    draw:transform="rotate({$dir1 * 3.14159 div 180})
     translate(8cm 7.5cm)"
    draw:style-name="solidLine"/>

<xsl:if test="$dir1 != $dir2">
    <draw:path draw:style-name="dashLine"
        draw:layer="layout"
        svg:viewBox="0 0 2000 100"
        svg:width="2cm" svg:height="0.1cm"
        svg:x="0cm" svg:y="0cm"
        svg:d="m 0 0 2000 0"
        draw:transform="rotate({$dir2 * 3.14159 div 180})
         translate(8cm 7.5cm)"/>
</xsl:if>

<!-- tick marks -->
<draw:path draw:style-name="solidLine" draw:layer="layout"
    svg:x="6cm" svg:y="5.5cm" svg:width="4.5cm" svg:height="4.5cm"
    svg:viewBox="0 0 4500 4500"
    svg:d="M 2000 0 v 125 M 4000 2000 h -125 M 2000 4000 v -125 M 0 2000 h 125"/>

<!-- create text near the tick marks -->
<xsl:for-each select="document('')/*/label:compass/label:text">
    <draw:frame draw:style-name="textgraphics" draw:layer="layout"
        svg:width="0.75cm" svg:height=".5cm">
        <xsl:attribute name="svg:x"><xsl:value-of
            select="5.625 + @x"/>cm</xsl:attribute>
        <xsl:attribute name="svg:y"><xsl:value-of
            select="5.25 + @y"/>cm</xsl:attribute>
        <draw:text-box>
            <text:p text:style-name="smallCenter"><xsl:value-of
                select="."/></text:p>
        </draw:text-box>
    </draw:frame>
</xsl:for-each>

<!-- text under the wind compass -->
<draw:frame
    draw:layer="layout"
    svg:x="6cm" svg:y="10cm" svg:height="1cm" svg:width="4cm">
    <draw:text-box>
        <text:p text:style-name="smallCenter">Wind Speed (m/sec)</text:p>
        <text:p text:style-name="smallCenter"><xsl:value-of
            select="$dir"/></text:p>
    </draw:text-box>
</draw:frame>
</xsl:template>

<label:compass>
    <label:text x="2" y="-0.25">N</label:text>
    <label:text x="4.375" y="2">E</label:text>
    <label:text x="2" y="4.25">S</label:text>
    <label:text x="-0.375" y="2">W</label:text>
</label:compass>
<label:text x="2" y="-0.25">N</label:text>
<label:text x="4.375" y="2">E</label:text>
<label:text x="2" y="4.25">S</label:text>
<label:text x="-0.375" y="2">W</label:text>
</label:compass>
| | This gets the direction part of the wind information by grabbing the substring before the separating comma. |
| | If there is a hyphen in the direction, then it must be split into two portions. This sets the first number. The weather report makes north zero degrees and east 90 degrees; OpenDocument says that east is zero and north is 90; hence the formula 90 - n. If there’s no hyphen, then the first direction is simply offset by -90 degrees. The number function ensures that string data will be converted to numeric form after stripping leading and trailing whitespace. |
| |
Similar code sets the second direction. You may wonder why
we didn’t use simpler code like this:
<xsl:choose>
<xsl:when test="contains($dir,'-')">
    <xsl:variable name="dir1"> ... </xsl:variable>
    <xsl:variable name="dir2"> ... </xsl:variable>
</xsl:when>
<xsl:otherwise>
    <xsl:variable name="dir1"> ... </xsl:variable>
    <xsl:variable name="dir2"> ... </xsl:variable>
</xsl:otherwise>
</xsl:choose>
Because a variable exists only within its enclosing block, this code won’t work—the <xsl:when> or <xsl:otherwise> would create the variables, which would disppear immediately upon encountering the ending </xsl:when> or </xsl:otherwise>. This is why we have to repeat all the choice code within the variable declarations. |
| | This draws the first line; we are guaranteed at least one line. Note the conversion of degrees to radians. To make the transformation easier, we draw the line starting at (0,0), rotate it around the “origin,” and then move the rotated line to its final position. The first line is always a solid line. |
| | The second line, if required, is always a dashed line. |
| | We use the same trick of accessing our “lookup table” for the labels and their relative positions. |
| | In these elements, as previously, the offsets are in centimeters. |
Finally, the thermometer. We are drawing the thermometer in two different segments: the straight part and the bulb. We will use a <draw:circle> for the bulb because OpenOffice.org doesn’t let us use a <draw:path> with the A (arc) command, and, frankly, the math for a cubic Bézier curve that approximates a circular arc was something that I was totally unwilling to attempt.
<xsl:template match="@T"> <xsl:variable name="fillcolor">
| | Rather than repeat the code for selecting the appropriate color, we store it in a variable. |
| | Lots of ugly math here, all to make sure that we make the polygon start at the (0,0) point. This formula will produce ugly results for temperatures above 50 and below -40 celsius. |
| | Again, we draw the outlines after the filled areas to ensure that they are always visible. |
| | Once again, we process <label:text> elements to make our work easier. The x and y attributes are in centimeters, and the tstyle attribute gives the text alignment as one of our pre-built styles. |
The resulting diagram looks something like Figure 6.9, “Finished Weather Report Drawing”.
If it seems like there is a lot of work to create such a simple drawing, you’re right. That’s because each object in a drawing is self-contained and needs to carry a lot of information with it.
Before we move on to three-dimensional drawing, we need to cover two more two-dimensional constructs: grouping objects and drawing connectors.
Let’s take a breather and look at something far easier—grouping objects. If you want to have objects grouped together (the effect of the Group menu item in the Modify menu), just put them all inside a <draw:g> element. This element is a simple container, without any particular properties of its own. Thus, if you want a transformation to apply to all of the objects in the group, you must apply the transformation to each object individually. Applying the draw:transform attribute to the <draw:g> element will have no effect.
Grouping is not the same as the Combine menu item. Combining objects works by creating a single <draw:path> element from all of the selected objects.
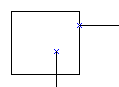
A connector is a line that joins objects and remains attached when you move them. Connectors are attached to “glue points” on the object. The default glue points are at the 12:00, 3:00, 6:00 and 9:00 positions, and are numbered clockwise 0 to 3. Figure 6.10, “Default Glue Points” shows a rectangle with a connector attached to glue point 1.

Each object joined by a connector has a unique draw:id, which is of the XML “ID” type, which must begin with an alphabetic character.
Once the two objects to be joined have their identifying numbers, OpenDocument uses a <draw:connector> element with the following attributes that are shared with the <draw:line> element:
- draw:style-name, draw:text-style-name
- These attributes refer to <style:style> elements; they allow you to have arrows and/or text on the connector.
- draw:layer
- As with lines, connectors are in the layout layer.
- svg:x1, svg:y1, svg:x2, svg:y2
- The endpoints of the connector.
The following additional attributes complete the connection information:
- draw:type
- The kind of connector: standard (the default, which has 90 degree “corners”), lines (multiple straight lines), line (a single straight line), or curve (curved line).
- draw:start-shape, draw:end-shape
- The beginning and ending shape numbers, as determined by their draw:id attributes.
- draw:start-glue-point, draw:end-glue-point
- The glue point on the starting and ending objects.
You may add custom glue points to an object. Figure 6.11, “Custom Glue Points” shows a rectangle with two extra glue points, one on the edge and one inside. Example 6.20, “XML for Custom Glue Points” shows the corresponding XML. Each glue point has an integer-valued draw:id attribute that gives the glue point number.
Example 6.20. XML for Custom Glue Points
<draw:rect draw:style-name="gr4" draw:id="id5"
  draw:layer="layout"
  svg:x="3.228cm" svg:y="10.769cm"
  svg:width="1.799cm" svg:height="1.667cm" >
	<draw:glue-point draw:id="5" svg:x="5.002cm" svg:y="-2.777cm"/>
	<draw:glue-point draw:id="6" svg:x="1.623cm" svg:y="1.349cm"/>
</draw:rect>
The svg:x and svg:y attributes are relative values, not absolute coordinates. Values range from -5cm (the left side or bottom) to 5cm (the right or top).
You may also set the direction from which a connector exits a glue point by setting the glue point’s draw:escape-direction to left, right, up, down, horizontal, or vertical.
Three-dimensional objects are contained in a <dr3d:scene> element. It has a large number of attributes that describe the scene’s shading and geometry. Within the scene are one or more <dr3d:light> elements, each one describing an illumination source, and one or more three-d shapes, which can be one of the following:
- <dr3d:cube>
- <dr3d:sphere>
- <dr3d:rotate> (an arbitrary path rotated about a central axis)
- <dr3d:extrude> (an arbitrary path extruded into a third dimension)
This element has the standard position-and-bounds attributes: svg:x, svg:y, svg:width, and svg:height. Along with these come the attributes specifically designed for three-dimensional objects. Many of these will specify vectors, which come in the form of an x-, y-, and z-coordinate in parentheses, separated by whitespace. OpenDocument’s coordinate system is a left-handed system: the positive z axis points out of the screen towards the person viewing the drawing. The values are measured in units of 1000 per centimeter.
- dr3d:vrp
- The origin of the viewing volume. This is not the same as the camera position. That is set by
- dr3d:distance, dr3d:focal-length
- These are both measured in centimeters.
- dr3d:vpn
- Direction the camera is pointing
- dr3d:vup
- “Which way is up?” This attribute tells you. The default is the vector (0 6760000 0).
- dr3d:projection
- This attribute has the value perspective (the default) or parallel. In perspective projection, objects get smaller as they become more distant.
- dr3d:shadow-slant
- A non-negative integer; default value is zero. No matter what the setting of this attribute, you will not see a shadow unless the object’s <style:style> element has dr3d:shadow set to visible.
- dr3d:shade-mode
- The default value is gouraud, which is the most “lifelike” shading. phong shading somewhat less so, and flat shading lets you see the polygons that make up the object in all their individual majesty.
- dr3d:ambient-color
- The ambient light color, as a hex value.
- dr3d:lighting-mode
- This boolean attribute has a default value of false. This attribute does not appear to have any effect.
The <dr3d:scene>’s first eight children are <dr3d:light> elements. Each element describes a light source that illuminates the object if its dr3d:enabled attribute is true. A light source has a dr3d:diffuse-color, the color of the light as a hex value; a dr3d:direction, a vector with default value is directly in front of the object—(0 0 1); and dr3d:specular, a boolean which tells whether you want reflective highlights from this light source. The first light source will have this value set to true; other light sources will have a value of <false>.
Following the lighting is the description of the three-d object itself. Cubes and spheres have their own special elements: <dr3d:cube> and <dr3d:sphere>. These need no attributes other than the draw:layer and controling draw:style-name. All other objects are described by a generic <dr3d:rotate> element, which describes a path exactly as described in the section called “Polylines, Polygons, and Free Form Curves”, with a svg:viewBox and svg:d attribute.
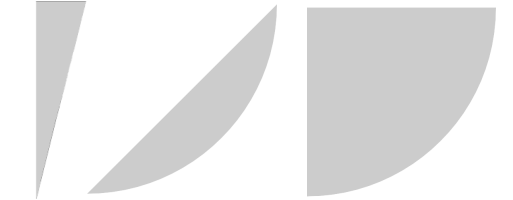
The path for a cylinder is a rectangle. The path for a cone is a triangle; note that the triangle is “upside-down.” The path for a torus is a circle, the path for a shell is a chord, and the path for a half-sphere is a quarter-circle, as shown in Figure 6.12, “Path for a Cone, Shell, and Half-Sphere”. When you convert an arbitrary path to a rotation object, your path becomes the path of the <dr3d:rotate> object.
Example 6.21, “XML for a Cylinder” shows the XML for a cylinder; only the single enabled light source is included.
Example 6.21. XML for a Cylinder
<dr3d:scene draw:name="cylinder" draw:style-name="gr5"
  svg:width="0.795cm" svg:height="1.589cm"
  svg:x="7.646cm" svg:y="9.26cm"
  dr3d:vrp="(0 0 16885.7142857143)" dr3d:vpn="(0 0 14285.7142857143)"
  dr3d:vup="(0 6760000 0)"
  dr3d:projection="perspective"
  dr3d:distance="2.6cm" dr3d:focal-length="10cm"
  dr3d:shadow-slant="0" dr3d:shade-mode="gouraud"
  dr3d:ambient-color="#666666" dr3d:lighting-mode="false">
    <dr3d:light
      dr3d:diffuse-color="#cccccc"
      dr3d:direction="(0.57735026918963 0.57735026918963 0.57735026918963)"
      dr3d:enabled="true" dr3d:specular="true"/>
    <dr3d:rotate draw:style-name="gr6" draw:layer="layout"
      svg:viewBox="0 -5000 2500 10000"
      svg:d="m0-5000h250 250 500 500 500 250
        250v10000h-250-250-500-500-500-250-250"/>
</dr3d:scene>
The final method of creating a three-dimensional object is by extrusion (as if the path were squeezed out of a toothpaste tube). An extruded object is represented by a <dr3d:extrude> object within the scene. It also contains svg:viewBox and svg:d attributes that define the coordinate system and path to be extruded.
Note
When you convert text to extruded three-dimensional objects, each letter is converted to a path which becomes a separate extruded object. The letters lose their identity as text, and are no longer editable as text.
As with all other drawing objects, the presentation is affected by a <style:style> referred to by the object’s draw:style-name property. Both the scene and the object have a draw:style-name, but only the one attached to the object controls the presentation—the one attached to the scene is ignored.
As with two-dimensional objects, you specify the color with draw:fill-color for solid colors, draw:gradient for a color range, draw:hatch for patterns, or draw:fill-image for bitmaps.
In addition to the two-dimensional drawing information, you may apply the following three-dimensional attributes:
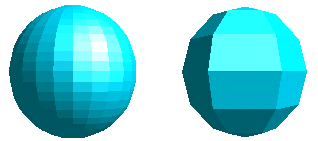
- dr3d:horizontal-segments, dr3d:vertical-segments
-
The number of horizontal segments tells how many
“slices” to stack up to create an object. The
number of vertical segments tells how many degrees to
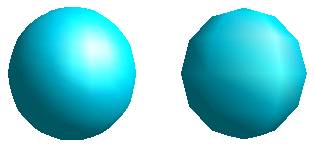
take when it rotates an object. Figure 6.13, “Flat-shaded Spheres with Differing Numbers of Segments”
shows a sphere drawn in two ways; the one on the left uses the
default values of 24 horizontal segments and 24 vertical
segments (i.e., rotation at 15 degree intervals).
The sphere on the right has only six horizontal segments and six vertical segments (rotation at 60 degree intervals). The figure uses flat shading to clearly display the difference. When using Gouraud shading, as shown in Figure 6.14, “Gouraud-shaded Spheres with Differing Numbers of Segments”, the default values assume a smooth spherical appearance.
Note
OpenOffice.org actually uses the same path information to generate a cone and a pyramid; the cone has 24 vertical segments and the pyramid has four, giving it a rectangular base.
- dr3d:end-angle
- This number, in tenths of a degree, tells where to stop the rotation about the y-axis. The default value is 3600. Rotation proceeds counterclockwise “into” the screen. Thus, a half-cone will show the sheared-off face with the rounded area behind it.
- dr3d:back-scale
- This attribute should be applied only to extruded objects. It gives the ratio of the size of the front of the object to the size of the back of the object. Thus, if the value is 50%, the front face of the object will be half the size of the back face.
- dr3d:depth
- This attribute’s value, given in centimeters (such as 1.25cm, tells the depth of an extruded object. It has no effect on rotated objects.
- dr3d:normals-kind, dr3d:normals-direction
- In these attributes, the word normal doesn’t mean “default”; it means “perpendicular to a surface.” The dr3d:normals-kind attribute tells how light reflects off an object. A value of flat shows individual polygons, sphere renders a smooth surface, and object chooses the best method depending upon the object. You may invert the light source (absorbing instead of reflecting) by setting <dr3d:normals-direction> to inverse The other value is normal, which in this case does mean “the ordinary way.”
- dr3d:diffuse-color, dr3d:emissive-color, dr3d:specular-color
- All of these attributes take a hexadecimal color specification as their value, and describe the behavior of the “material” that the the object is made of. dr3d:diffuse-color is the color of light from outside that scatters when reflected. dr3d:emissive-color is the color of light that the object itself emits. dr3d:specular-color is the color of reflective highlights.
- dr3d:shininess
- This is a percent value which appears to be implemented in the opposite way that its name implies. A shininess of 100% produces a non-reflective object; a shininess of 0% produces a highly reflective one.
- dr3d:close-front, dr3d:close-back
- Apply these boolean attributes to extruded objects. Specify true if you want the front and/or back face of the object to be displayed, false if you don’t.
- dr3d:shadow
- The default value for this attribute is hidden; if set to visible, a three-d shadow appears. This attribute overrides the draw:shadow attribute.
- style:repeat
- If you are using a bitmap for your object, you may set this attribute to repeat to tile the surface or stretch to wrap the object in the bitmap.
- dr3d:texture-kind
- Another attrbute for textured objects (bitmap fill) that seems to be contradictory: You may select color, which produces a black-and-white effect. Selecting luminance, the default, shows the bitmap in color.
- dr3d:texture-mode
- When set to blend, you see both the bitmap and the fill color (where the bitmap is transparent). When set to modulate, you see only the bitmap.
- dr3d:texture-generation-mode-x, dr3d:texture-generation-mode-y
- These attributes determine how the texture coordinates are generated when wrapping a bitmap around an object. The possible values are object (object-dependent), parallel, and sphere.
There are two other three-d attributes whose settings appear to have no effect on the picture: dr3d:backface-culling and dr3d:texture-filter. Both these attributes may either be enabled or disabled.
[7] If there is no length for the first sequence of dots, then they appear as points of minimal size.
[8] It is possible to achieve the same effect in a more difficult way: by grouping a separate text and line object.
[9] If you are creating a file on your own, you may put gradients in the content.xml file.
[10] All objects can also have a draw:text-style-name attribute if you attach text to them, as described in the section called “Attaching Text to a Line”, but that attribute is not included in these examples.
[11] The first L is also unnecessary; points after a first Move are presumed to be lines.