Table of Contents
OpenDocument includes a powerful specification for making charts. You may place a chart in a word processing document, a drawing, a presentation, or a spreadsheet.
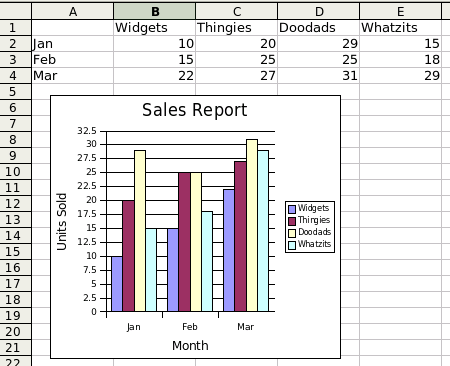
Before proceeding to the actual XML, let’s define some of the terms that are used when talking about charts. Consider the spreadsheet section shown in Figure 8.1, “Chart Derived from Spreadsheet”. In this chart, there are three categories: January, February, and March–the months of the first quarter of the year. Each of the items sold has a series of three data points or values. The values are the numbers in the spreadsheet, and they appear on the y-axis.
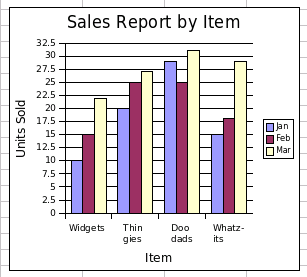
It is also possible to describe a chart where each row is a series of data points, and the columns are the categories. This produces a chart of sales by items sold, shown in Figure 8.2, “Chart with Series in Rows”. Here, each month has a series of four data points, one for each item.
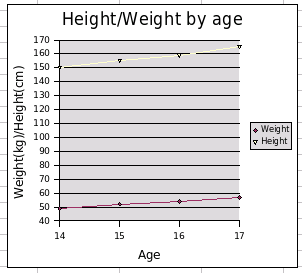
In an x-y chart (such as the scatter chart in Figure 8.3, “Scatter Chart”), the x-axis is called the domain, as in the domain of an algebraic function.
Rather than being inserted directly into the content.xml, the chart is inserted as a <draw:object> element. This element will have an xlink:href attribute of the form ./Object 1. If you know your URLs, you see that this points to a subdirectory named Object 1. Inside that directory you will find another content.xml file that contains the chart data and style information.
Note
The object’s directory also contains a styles.xml file, but it is just a placeholder; Its root element is a <office:document-styles> that contains an empty <office:styles> element. If you are creating a chart from scratch, you may omit the styles.xml file.
In addition to creating the link and the subdirectory, you must also add entries in the META-INF/manifest.xml file in order for an OpenDocument-compatible application to locate the chart. The entries must define the paths for the subdirectory and the content.xml and style.xml files in the subdirectory (if present).
No matter which type of document you insert a chart into, the chart’s <draw:object> element will contain the following attributes:
- xlink:href contains the URL of the object subdirectory.
- xlink:type has the value simple.
- xlink:show has the value embed.
- xlink:actuate has the value onLoad.
The <draw:object> element for a chart embedded in a word processing document will be contained in a <draw:frame>.
Since the object is inside a frame, the <draw:frame> element will contain all the attributes described in the section called “Body Information for Frames” with one exception. Instead of an fo:min-height attribute, the object will have a svg:height attribute to specify the height of the chart. The <draw:object> will also contain a draw:notify-on-update-of-ranges attribute whose value is the name of the table that is being charted. Example 8.1, “XML for a Chart in a Word Processing Document” shows the XML for a chart anchored as a paragraph.
Example 8.1. XML for a Chart in a Word Processing Document
<text:p text:style-name="Text_20_body">
    <draw:frame draw:style-name="fr1" draw:name="Object1"
      text:anchor-type="paragraph"
      svg:width="7.999cm" svg:height="7.001cm"
      draw:z-index="0">
        <draw:object xlink:href="./Object 1"
          xlink:type="simple" xlink:show="embed"
          xlink:actuate="onLoad" draw:notify-on-update-of-ranges="Table1"/>
          <draw:image xlink:href="./ObjectReplacements/Object 1"
            xlink:type="simple" xlink:show="embed"
            xlink:actuate="onLoad"/>
    </draw:frame>
</text:p>
The <draw:image> element contains a reference to some sort of vector-based representation of the chart. In case the chart object itself is missing, an OpenDocument-compatible application can display this replacement picture.
When you insert a chart into a drawing, the <draw:object> again goes inside a <draw:frame> element which gets these attributes:
- draw:layer (either layout or background).
- svg:x and svg:y determine the upper left corner of the chart.
- svg:width and svg:height determine the chart’s dimensions.
- draw:style-name gives the controlling style for the chart; usually standard.
The <draw:object> element has the same attributes as described in the section called “Common Attributes for <draw:object>”.
Charts in spreadsheets are special; they display data that is within the rows and columns of the spreadsheet. Here are the <draw:object> attributes in question:
- draw:notify-on-update-of-ranges
- The value of this attribute is the range of cells that contain the chart data, such as Sheet1.A1:Sheet1.D4.
- table:end-cell-address
- This is the cell that the lower right corner of the chart covers, in a form such as Sheet1.G21. (The starting cell is the table cell that holds the <draw:object> element.)
- table:end-x, table:end-y
- These attributes have a length value that tells how far the chart extends into the ending cell. If these attributes are not present, the chart will not display. You may set the values to zero.
- svg:x, svg:y
- These attributes have a length value that tells how far the upper left corner of the chart is from the upper left of the first cell in which the chart resides. The default value for these attributes is zero.
- svg:width, svg:height
- These attributes give the size of the chart.
Example 8.2, “XML for Chart in Spreadsheet” shows the XML that embeds a chart shown in Figure 8.1, “Chart Derived from Spreadsheet” into a spreadsheet.
Example 8.2. XML for Chart in Spreadsheet
<draw:frame
  table:end-cell-address="Sheet1.D22"
  table:end-x="0.6728in" table:end-y="0.0213in"
  draw:z-index="0"
  svg:width="3.1441in" svg:height="2.752in"
  svg:x="0.1953in" svg:y="0.115in">
    <draw:object
      draw:notify-on-update-of-ranges="Sheet1.A1:Sheet1.E4"
      xlink:href="./Object 1" xlink:type="simple"
      xlink:show="embed" xlink:actuate="onLoad"/>
    <draw:image
      xlink:href="./ObjectReplacements/Object 1
      xlink:type="simple" xlink:show="embed"
      xlink:actuate="onLoad"/>
</draw:frame>
You find the actual chart data and specifications in the content.xml file that is in the object subdirectory. This file follows the same general pattern that we have seen for content files of all the other document types. The first child of the root <office:document-content> is an <office:automatic-styles> element that contains all the styles to control the chart’s presentation.
The styles are followed by the <office:body>, which contains an <office:chart> element which in turn contains a <chart:chart> element. This has child elements that specify:
- The chart title, subtitle, and legend.
- The plot area, which includes dimensions and:
- The chart axes and grid.
- Chart categories and data series.
- A <table:table> that provides the data to be charted.
Now let’s take a closer look at the chart:chart element and its attributes and children. The chart:class attribute tells what kind of chart to draw: chart:line, chart:area (stacked areas), chart:circle (pie chart), chart:ring, chart:scatter, chart:radar (called “net”) in OpenOffice.org, chart:bar, chart:stock, and chart:add-in.
The <chart:chart> element has these children, in this order:
- An optional <chart:title> element.
- An optional <chart:subtitle> element.
- An optional <chart:legend> element.
- A <chart:plot-area> element that describes the axes and grid.
- An optional <table:table> containing the table data.
The <chart:title> and <chart:subtitle> elements have svg:x and svg:y attributes for positioning, and a chart:style-name for presentation. They contain a <text:p> element that gives the title (or subtitle) text, as shown in Example 8.3, “Example of Chart Title and Subtitle”
Example 8.3. Example of Chart Title and Subtitle
<chart:title svg:x="2.225cm" svg:y="0.28cm" chart:style-name="ch2">
    <text:p>Sales Report</text:p>
</chart:title>

<chart:subtitle svg:x="4.716cm" svg:y="0.814cm" chart:style-name="ch3">
    <text:p>First Quarter</text:p>
</chart:subtitle>
The <chart:legend> element has a chart:legend-position attribute that gives the relative location of the legend; top, start (left), bottom, or end (right), and an absolute svg:x and svg:y position. It also has a chart:style-name attribute to determine the presentation of the text in the legend.
The next element in line is a <chart:plot-area> element. This element is where the action is. It establishes the location of the chart with the typical svg:x, svg:y, svg:width, and svg:height attributes.
If you are creating a chart from a spreadsheet, you will specify the source of the data in the table:cell-range-address attribute. Depending on whether this range of cells contains labels for the rows or columns, you must set chart:data-source-has-labels to none, row, column, or both. The <chart:table-number-list> is not used in the XML format, and should be set to 0.
You may be tempted to overlook the standard chart:style-name attribute, but that would be a mistake, because that style is just packed with information.
- chart:lines
- true for a line chart, false for any other type of chart.
- chart:symbol-type
- Used only with line charts, this is set to automatic to allow the application to cycle through a series of pre-defined symbols to mark points on the line chart.
- chart:splines, chart:spline-order, chart:spline-resolution
- If you are using splines instead of lines, then chart:interpolation will be cubic-spline, and you must specify the chart:spline-order (2 for cubic splines). The chart:spline-resolution tells how smooth the curve is; the larger the number, the smoother the curve; the default value is 20.
- chart:vertical, chart:stacked, chart:percentage, chart:connect-bars
- These booleans are used for bar charts. If chart:vertical is true then bars are drawn along the vertical axis from left to right (the default is false for bars drawn up and down along the horizontal axis). chart:stacked tells whether bars are stacked or side-by-side. This is mutually exclusive with chart:percentage, which draws stacked bars by default. The chart:connect-bars attribute is only used for stacked bars or percentage charts; it draws lines connecting the various levels of bars.
- chart:lines-used
- The default value is zero; it is set to one if a bar chart has lines on it as well.
- chart:stock-updown-bars, chart:stock-with-volume, chart:japanese-candle-stick
- These boolean attributes apply only when chart:class is stock. The chart:japanese-candle-stick attribute is set to true if you want a box drawn between the upper and lower limits rather than just two lines.
- chart:series-source
- If your source data has its data series in rows instead of columns, set this attribute to rows instead of the default columns.
- chart:data-label-number
- Is the data labeled with the value, a percentage, or none (the default).
- chart:data-label-text, chart:data-label-symbol
- Should all data points have a text label (the name of the corresponding series) and/or the legend symbol next to them? Set these to true or the default false.
Example 8.4, “Plot Area and Style” shows the opening <chart:plot-area> element (and its associated style) for the bar chart in Figure 8.1, “Chart Derived from Spreadsheet”.
Example 8.4. Plot Area and Style
<chart:plot-area
chart:style-name="ch5"
table:cell-range-address="Sheet1.$A$1:.$E$4"
chart:data-source-has-labels="both"
chart:table-number-list="0"
svg:x="0.158cm" svg:y="1.672cm"
svg:width="6.006cm" svg:height="5.181cm">
<!-- the associated style -->
<style:style style:name="ch5" style:family="chart">
<style:chart-properties
chart:series-source="columns"  chart:vertical="false"
chart:connect-bars="false"
chart:lines="false" chart:lines-used="0"
chart:vertical="false"
chart:connect-bars="false"
chart:lines="false" chart:lines-used="0"  chart:symbol-type="none"
chart:data-label-number="none"
chart:symbol-type="none"
chart:data-label-number="none"  chart:data-label-text="false"
chart:data-label-symbol="false"
chart:interpolation="none"
chart:mean-value="false"
chart:data-label-text="false"
chart:data-label-symbol="false"
chart:interpolation="none"
chart:mean-value="false"  chart:error-margin="0" chart:error-lower-limit="0"
chart:error-upper-limit="0" chart:error-category="none"
chart:error-percentage="0" chart:regression-type="none"
chart:three-dimensional="false" chart:deep="false"
chart:error-margin="0" chart:error-lower-limit="0"
chart:error-upper-limit="0" chart:error-category="none"
chart:error-percentage="0" chart:regression-type="none"
chart:three-dimensional="false" chart:deep="false"  chart:stock-with-volume="false"
chart:japanese-candle-stick="false"/>
</style:style>
chart:stock-with-volume="false"
chart:japanese-candle-stick="false"/>
</style:style>
| | The values for these first three attributes are the default values, so they aren’t really needed in this case. |
| | If you were creating a line chart, you’d need the first of these attributes, but you can leave them out for a bar chart. The second attribute is not in the OpenDocument specification, but does appear in the OpenOffice.org document. |
| | These are all set to none or false so that no extra labelling appears next to the data points. |
| | Because this is an “essentials” book, we didn’t talk about these attributes at all. They are used if you use the Insert/Statistics menu in OpenOffice.org. |
| | Finally, these attributes are all false because this is neither a three-d chart nor a stock chart. |
Within the <chart:plot-area> element are two <chart:axis> elements; the first for the x-axis and the second for the y-axis. For pie charts, there is only one axis; the y-axis.
Each <chart:axis> has a chart:name attribute, which is either primary-x or primary-y. The chart:class attribute tells whether the axis represents a category, value, or domain. (This last is for the x-axis of a scatter chart.) There is a child chart:categories if this axis determines the categories. Of course, there’s a chart:style-name, and the style it refers to also contains oodles of information about how to display the axis:
- chart:display-label
- A boolean that determines whether to display a label with this axis or not.
- chart:tick-marks-major-inner, chart:tick-marks-major-outer, chart:tick-marks-minor-inner, chart:tick-marks-minor-outer
- These four booleans tell whether you want tick marks at major and minor intervals, and whether you want them to appear outside the chart area or inside the chart area.
- chart:logarithmic
- Set this to true if you want a logarithmic scale for the numbers on the given axis.
- text:line-break
- In order to fit labels into small charts, the application will break words. For example, a category label of “Northwest” may appear with “North” on one line and “west” beneath it. You can turn off this action by setting the attribute to false.
- chart:text-overlap
- If you turn off line break and your chart is small, but its labels are long, then the labels may overlap. If you don’t want this to happen, set this attribute to its default value of false. An application will then avoid displaying some of the labels rather than have labels display on top of one another. If you don’t mind the overwriting, set this attribute to true.
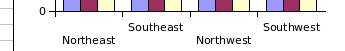
- chart:label-arrangement
- Ordinarily the labels on a chart appear side-by-side (the default value). You may avoid overlap by setting this value to stagger-even or stagger-odd. Figure 8.4, “Chart With Even-Staggered Labels” shows the labels for a chart with this attribute set to stagger-even.
- chart:visible
-
Set this to false if you don’t want to see
any labels or tick marks at all.
Warning
Don’t set this to false unless you have a compelling reason to do so. Graphs without labels are confusing at best and misleading or useless at worst.
If your axis has a title, then the <chart:axis> element will have a <chart:title> child element, formatted exactly like the chart’s main title.
The last child of the <chart:axis> element is the optional <chart:grid> element. Its chart:class attribute tells whether you want grid lines at major intervals only (major), or at both major and minor intervals (minor). For no grid lines, omit the element.
We still haven’t finished the <chart:plot-area> element yet; after specifying the axes and grid, we must now define what data series are in the chart.
The XML will continue with one <chart:series> element for each data series in the chart. It has a chart:style-name that refers to a style for that data series.
For line charts, this style needs to specify only the draw:fill-color and svg:stroke-color. For bar and pie charts, you need to specify only draw:fill-color.
For line and bar charts, each <chart:series> element contains a <chart:data-point> element; its chart:repeated attribute tells how many data points are in the series. A pie chart has only one chart:series element that contains multiple chart:data-point elements; one for each pie slice, and each will have its own chart:style-name attribute.
The chart wall is the area bounded by the axes (as opposed to the plot area, which is the entire chart). The empty <chart:wall> element has a chart:style-name attribute, used primarily to set the background color. The chart floor is applicable only to three-dimensional charts, and will be covered in that section.
This has been an immense amount of explanation, and we need to see how this all fits together. Example 8.5, “Styles and Content for a Bar Chart” shows the XML (so far) for the chart shown in Figure 8.1, “Chart Derived from Spreadsheet”.
Example 8.5. Styles and Content for a Bar Chart
<chart:chart svg:width="8.002cm" svg:height="6.991cm"
  chart:class="chart:bar" chart:style-name="ch1">
    <chart:title svg:x="2.549cm" svg:y="0.138cm"
      chart:style-name="ch2">
        <text:p>Sales Report</text:p>
    </chart:title>

    <chart:legend chart:legend-position="end"
      svg:x="6.492cm" svg:y="2.824cm" chart:style-name="ch3"/>

    <chart:plot-area chart:style-name="ch4"
      table:cell-range-address="Sheet1.$A$1:.$E$4"
      chart:data-source-has-labels="both"
      chart:table-number-list="0"
      svg:x="0.16cm" svg:y="0.945cm"
      svg:width="6.013cm" svg:height="5.908cm">
        <chart:axis chart:dimension="x"
          chart:name="primary-x" chart:style-name="ch5">
            <chart:categories table:cell-range-address="local-table.A2:.A4"/>
        </chart:axis>

        <chart:axis chart:dimension="y"
          chart:name="primary-y" chart:style-name="ch6">
            <chart:grid chart:class="major"/>
        </chart:axis>

        <chart:series chart:style-name="ch7">
            <chart:data-point chart:repeated="3"/>
        </chart:series>
        <chart:series chart:style-name="ch8">
            <chart:data-point chart:repeated="3"/>
        </chart:series>
        <chart:series chart:style-name="ch9">
            <chart:data-point chart:repeated="3"/>
        </chart:series>
        <chart:series chart:style-name="ch10">
            <chart:data-point chart:repeated="3"/>
        </chart:series>

        <chart:wall chart:style-name="ch11"/>

        <chart:floor chart:style-name="ch12"/>
    </chart:plot-area>

    <!-- data table follows -->

</chart:chart>
Example 8.6, “Styles for Bar Chart Excerpt” shows the corresponding styles, cut down to minimal size. For example, in the styles for <chart:series> elements, we have left out the <style:text-properties> element because the bars are not labelled. For variety, we have used fo:font-family on some styles to explicitly specify a font, and in others we have used style:font-family-generic to specify the font. Comments have been added to indicate which styles apply to which parts of the chart.
Example 8.6. Styles for Bar Chart Excerpt
<!-- style for <chart:chart> element -->
<style:style style:name="ch1" style:family="chart">
<style:graphic-properties draw:stroke="solid"
draw:fill-color="#ffffff"/>
</style:style>
<!-- style for <chart:title> element -->
<style:style style:name="ch2" style:family="chart">
<style:text-properties fo:font-family="'Bitstream Vera Sans'"
style:font-family-generic="swiss" fo:font-size="13pt"/>
</style:style>
<!-- style for <chart:legend> element -->
<style:style style:name="ch3" style:family="chart">
<style:properties style:font-family-generic="swiss"
fo:font-size="6pt"/>
</style:style>
<!-- style for <chart:plot-area> element -->
<style:style style:name="ch4" style:family="chart">
<style:chart-properties chart:series-source="columns"
chart:lines="false" chart:vertical="false"
chart:connect-bars="false"/>
</style:style>
<!-- style for first <chart:axis> (x-axis) -->
<style:style style:name="ch5" style:family="chart"
style:data-style-name="N0">
<style:chart-properties chart:display-label="true"
chart:tick-marks-major-inner="false"
chart:tick-marks-major-outer="true"
text:line-break="true"
chart:label-arrangement="side-by-side" chart:visible="true"/>
<style:graphic-properties draw:stroke="solid"
svg:stroke-width="0cm" svg:stroke-color="#000000"/>
<style:text-properties style:font-family-generic="swiss"
fo:font-size="7pt"/>
</style:style>
<!-- style for second <chart:axis> (y-axis) -->
<style:style style:name="ch6" style:family="chart"
style:data-style-name="N0">
<style:chart-properties chart:display-label="true"
chart:tick-marks-major-inner="false"
chart:tick-marks-major-outer="true"
text:line-break="false"\
chart:label-arrangement="side-by-side" chart:visible="true"/>
<style:graphic-properties draw:stroke="solid"
svg:stroke-width="0cm" svg:stroke-color="#000000"/>
<style:text-properties style:font-family-generic="swiss"
fo:font-size="7pt"/>
</style:style>
<!-- style for the first <chart:series> element -->
<style:style style:name="ch7" style:family="chart">
<style:graphic-properties draw:fill-color="#9999ff"/>
</style:style>
<!-- style for the second <chart:series> element -->
<style:style style:name="ch8" style:family="chart">
<style:graphic-properties draw:fill-color="#993366"/>
</style:style>
<!-- style for the third <chart:series> element -->
<style:style style:name="ch9" style:family="chart">
<style:graphic-properties draw:fill-color="#ffffcc"/>
</style:style>
<!-- style for the fourth <chart:series> element -->
<style:style style:name="ch10" style:family="chart">
<style:graphic-properties draw:fill-color="#ccffff"/>
</style:style>
<!-- style for the <chart:wall> element -->
<style:style style:name="ch11" style:family="chart">
<style:graphic-properties draw:stroke="none" draw:fill="none"/>
</style:style>
<!-- style for the <chart:floor> element -->
<style:style style:name="ch12" style:family="chart">
<style:graphic-properties draw:stroke="none" draw:fill-color="#999999"/>
</style:style>
Following the plot area is a table containing the data to be displayed. Even if you are creating a chart from a spreadsheet, OpenOffice.org does not look at the spreadsheet cells for the data—it looks at the internal table in the chart object’s content.xml file.
Compared to the chart and plot area definitions, the data table is positively anticlimactic. The <table:table> element has a table:name attribute which is set to local-table.
The first child of the <table:table> is a <table:table-header-columns> element that contains an empty <table:table-column> element. This is followed by a <table:table-header-rows> element that contains the first row of the table. Finally, a <table:table-rows> element contains the remaining data, one <table:table-row> at a time.
Example 8.7, “Table for Bar Chart” gives an excerpt of the table that was used in Figure 8.1, “Chart Derived from Spreadsheet”.
Example 8.7. Table for Bar Chart
<table:table table:name="local-table">
    <table:table-header-columns>
        <table:table-column/>
    </table:table-header-columns>
    <table:table-columns>
        <table:table-column table:number-columns-repeated="4"/>
    </table:table-columns>

    <table:table-header-rows>
        <table:table-row>
            <table:table-cell>
                <text:p/>
            </table:table-cell>
            <table:table-cell table:value-type="string">
                <text:p>Widgets</text:p>
            </table:table-cell>
            <table:table-cell table:value-type="string">
                <text:p>Thingies</text:p>
            </table:table-cell>
            <table:table-cell table:value-type="string">
                <text:p>Doodads</text:p>
            </table:table-cell>
            <table:table-cell table:value-type="string">
                <text:p>Whatzits</text:p>
            </table:table-cell>
        </table:table-row>
    </table:table-header-rows>

    <table:table-rows>
        <table:table-row>
            <table:table-cell table:value-type="string">
                <text:p>Jan</text:p>
            </table:table-cell>
            <table:table-cell table:value-type="float" table:value="10">
                <text:p>10</text:p>
            </table:table-cell>
            <table:table-cell table:value-type="float" table:value="20">
                <text:p>20</text:p>
            </table:table-cell>
            <table:table-cell table:value-type="float" table:value="29">
                <text:p>29</text:p>
            </table:table-cell>
            <table:table-cell table:value-type="float" table:value="15">
                <text:p>15</text:p>
            </table:table-cell>
        </table:table-row>

        <!-- February row, similar to January above -->

        <table:table-row>
            <table:table-cell table:value-type="string">
                <text:p>Mar</text:p>
            </table:table-cell>
            <table:table-cell table:value-type="float" table:value="22">
                <text:p>22</text:p>
            </table:table-cell>
            <table:table-cell table:value-type="float" table:value="27">
                <text:p>27</text:p>
            </table:table-cell>
            <table:table-cell table:value-type="float" table:value="31">
                <text:p>31</text:p>
            </table:table-cell>
            <table:table-cell table:value-type="float" table:value="29">
                <text:p>29</text:p>
            </table:table-cell>
        </table:table-row>
    </table:table-rows>
</table:table>
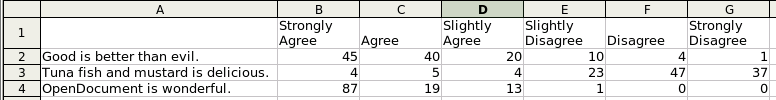
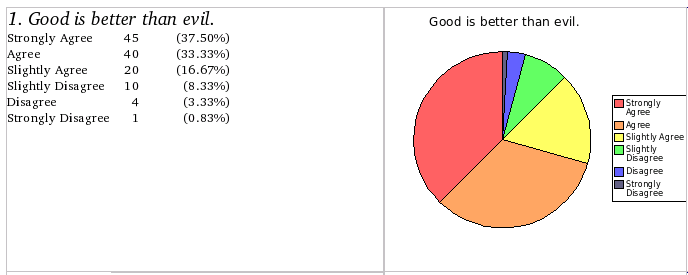
We are now prepared to do a rather complex case study. We will begin with an OpenDocument spreadsheet that contains the results of a survey[13], as shown in Figure 8.5, “Spreadsheet with Survey Responses”. Our goal is to create a word processing document. Each question will be displayed in a two-column section. The left column will contain the question and the results in text form; the right column will contain a pie chart of the responses to the question. The result will look like Figure 8.6, “Text Document with Survey Responses”.
The Perl code is fairly lengthy, though most of it is just “boilerplate.” We have broken it into sections for ease of analysis. We will use the XML::DOM module to parse the input file for use with the Document Object Model. We won’t use the DOM to create the output file; we’ll just create raw XML text and put it into temporary files, which will eventually be added to the output .zip file. Let’s begin with the variable declarations. [You will find the entire Perl program in file chartmaker.pl in directory ch08 in the downloadable example files.]
#!/usr/bin/perl use Archive::Zip; use XML::DOM; use warnings; use strict; # # Command line arguments: # input file name # output file name my $doc; # the DOM document my $rows; # all the <table:table-row> elements my $n_rows; # number of rows my $row; # current row number my $col; # current column number my @data; # contents of current row my $sum; # sum of the row items my @legends; # legends for the graph my $main_handle; # content/style file handle
| | The <variable>$name_handle</variable> and <variable>$name_filename</variable> are the file handle and file name returned by Archive::Zip->tempFile(). |
| | All the temporary files need to be kept around until the .zip file is finally written; adding a file to the archive just adds the name to a list. This means we have to keep the temporary file names around until all the data is processed. |
Here is the code to read the input spreadsheet, followed by utility routines to assist in processing the DOM tree.
#
#   Extract the content.xml file from the given
#   filename, parse it, and return a DOM object.
#
sub makeDOM
{
    my ($filename) = shift;
    my $input_zip = Archive::Zip->new( $filename );
    my $parser = new XML::DOM::Parser;
    my $doc;
    my $temp_handle;
    my $temp_filename;

    ($temp_handle, $temp_filename) = Archive::Zip->tempFile();

    $input_zip->extractMember( "content.xml", $temp_filename );

    $doc = $parser->parsefile( $temp_filename );
    unlink $temp_filename;
    return $doc;
}

#
#   $node - starting node
#   $name - name of desired child element
#   returns the node's first child with the given name
#
sub getFirstChildElement
{
    my ($node, $name) = @_;
    for my $child ($node->getChildNodes)
    {
        if ($child->getNodeName eq $name)
        {
            return $child;
        }
    }
    return undef;
}

#
#   $node - starting node
#   $name - name of desired sibling element
#   returns the node's next sibling with the given name
#
sub getNextSiblingElement
{
    my ($node, $name) = @_;

    while (($node = $node->getNextSibling) &&
        $node->getNodeName ne $name)
    {
        # do nothing
        ;
    }

    return $node;
}

#
#   $itemref - Reference to an array to hold the row contents
#   $rowNode - a table row
#
sub getRowContents
{
    my ($itemRef, $rowNode) = @_;
    my $cell;           # a cell node
    my $value;
    my $n_repeat;
    my $i;
    my $para;   # <text:p> node

    @{$itemRef} = ();
    $cell = getFirstChildElement( $rowNode, "table:table-cell" );
    while ($cell)
    {
        $n_repeat = $cell->getAttribute("table:number-columns-repeated");
        $n_repeat = 1 if (!$n_repeat);

        $value = "";
        $para = getFirstChildElement( $cell, "text:p" );
        while ($para)
        {
            $value .= $para->getFirstChild->getNodeValue . " ";
            $para = getNextSiblingElement( $para, "text:p" );
        }
        chop $value;

        for ($i=0; $i < $n_repeat; $i++)
        {
            push @{$itemRef}, $value;
        }
        $cell = getNextSiblingElement( $cell, "table:table-cell" );
    }
}
| | Because an XML file may have newlines and tabs between elements, the first child of an element may not necessarily be another element. That means that the DOM’s getFirstChild method might return a text node. Hence this utility routine, which bypasses text nodes and gets the specific element node that we are interested in. |
| | Similarly, the presence of newlines means we can’t use the getNextSibling method, but must use this utility to bypass text nodes and get to the element we are interested in. |
| | Ths routine takes a <table:table-row> element and creates an array with all the row’s values. It expands repeated cells (where the table:number-columns-repeated attribute is present). |
| | A table cell can contain multiple paragraphs; we concatenate them into one long string with blanks between each paragraph. |
We start the main program by parsing the input file and emitting boilerplate for the styles.xml file, which is devoted to setting up the page dimensions.
if (scalar @ARGV != 2)
{
    print "Usage: $0 inputfile outputfile\n";
    exit;
}

print "Processing $ARGV[0]\n";

$doc = makeDOM( $ARGV[0] );

$zip = Archive::Zip->new();

($main_handle, $main_filename) = Archive::Zip->tempFile();
push @temp_filename, $main_filename;

print $main_handle <<"STYLEINFO";
<office:document-styles
  xmlns:office="urn:oasis:names:tc:opendocument:xmlns:office:1.0"
  xmlns:style="urn:oasis:names:tc:opendocument:xmlns:style:1.0"
  xmlns:text="urn:oasis:names:tc:opendocument:xmlns:text:1.0"
  xmlns:table="urn:oasis:names:tc:opendocument:xmlns:table:1.0"
  xmlns:draw="urn:oasis:names:tc:opendocument:xmlns:drawing:1.0"
  xmlns:fo="urn:oasis:names:tc:opendocument:xmlns:xsl-fo-compatible:1.0"
  xmlns:xlink="http://www.w3.org/1999/xlink"
  xmlns:number="urn:oasis:names:tc:opendocument:xmlns:datastyle:1.0"
  xmlns:svg="urn:oasis:names:tc:opendocument:xmlns:svg-compatible:1.0"
  xmlns:chart="urn:oasis:names:tc:opendocument:xmlns:chart:1.0"
  xmlns:dr3d="urn:oasis:names:tc:opendocument:xmlns:dr3d:1.0"
  xmlns:math="http://www.w3.org/1998/Math/MathML"
  xmlns:script="urn:oasis:names:tc:opendocument:xmlns:script:1.0"
  xmlns:dom="http://www.w3.org/2001/xml-events"
  office:version="1.0">

    <office:automatic-styles>
        <style:page-layout style:name="pm1">
            <style:page-layout-properties
              fo:page-width="21.59cm" fo:page-height="27.94cm"
              style:num-format="1" style:print-orientation="portrait"
              fo:margin-top="1.27cm" fo:margin-bottom="1.27cm"
              fo:margin-left="1.27cm" fo:margin-right="1.27cm"
              style:writing-mode="lr-tb" style:footnote-max-height="0cm">
                <style:columns fo:column-count="0" fo:column-gap="0cm"/>
            </style:page-layout-properties>
            <style:header-style/>
            <style:footer-style/>
        </style:page-layout>
    </office:automatic-styles>
    <office:master-styles>
        <style:master-page style:name="Standard" style:page-layout-name="pm1"/>
    </office:master-styles>
</office:document-styles>
STYLEINFO

close $main_handle;
$zip->addFile( $main_filename, "styles.xml" );
The next step is to start creating the manifest file. This code is the boilerplate for the main directory files; as we create the charts, we will append elements to the manifest file.
#
#   Create manifest file and its boilerplate
#

($manifest_handle, $manifest_filename) = Archive::Zip->tempFile();
push @temp_filename, $manifest_filename;

print $manifest_handle <<"MANIFEST_HEADER";
<!DOCTYPE manifest:manifest
    PUBLIC "-//OpenOffice.org//DTD Manifest 1.0//EN" "Manifest.dtd">
<manifest:manifest
  xmlns:manifest="urn:oasis:names:tc:opendocument:xmlns:manifest:1.0">
    <manifest:file-entry
        manifest:media-type="application/vnd.oasis.opendocument.text"
        manifest:full-path="/"/>
    <manifest:file-entry
        manifest:media-type="text/xml" manifest:full-path="content.xml"/>
    <manifest:file-entry
        manifest:media-type="text/xml" manifest:full-path="styles.xml"/>
MANIFEST_HEADER
Warning
Because we do not creating a settings.xml file, OpenOffice.org will think your document has not been saved when you first load it.
And now, the main event: the content.xml file. First, the boilerplate for the styles that we will need for the text and the chart itself:
#
# Create the main content.xml file and its
# header information
#
($main_handle, $main_filename) = Archive::Zip->tempFile();
push @temp_filename, $main_filename;
print $main_handle <<"CONTENT_HEADER";
<?xml version="1.0" encoding="UTF-8"?>
<office:document-content
xmlns:office="urn:oasis:names:tc:opendocument:xmlns:office:1.0"
xmlns:style="urn:oasis:names:tc:opendocument:xmlns:style:1.0"
xmlns:text="urn:oasis:names:tc:opendocument:xmlns:text:1.0"
xmlns:table="urn:oasis:names:tc:opendocument:xmlns:table:1.0"
xmlns:draw="urn:oasis:names:tc:opendocument:xmlns:drawing:1.0"
xmlns:fo="urn:oasis:names:tc:opendocument:xmlns:xsl-fo-compatible:1.0"
xmlns:xlink="http://www.w3.org/1999/xlink"
xmlns:number="urn:oasis:names:tc:opendocument:xmlns:datastyle:1.0"
xmlns:svg="urn:oasis:names:tc:opendocument:xmlns:svg-compatible:1.0"
xmlns:chart="urn:oasis:names:tc:opendocument:xmlns:chart:1.0"
xmlns:script="urn:oasis:names:tc:opendocument:xmlns:script:1.0"
office:version="1.0">
<office:scripts/>
<office:font-face-decls>
<style:font-face style:name="Bitstream Charter"
svg:font-family="'Bitstream Charter'"
style:font-pitch="variable"/>
</office:font-face-decls>
<office:automatic-styles>
<!-- style for question title -->
<style:style style:name="hdr1" style:family="paragraph">
<style:text-properties
style:font-name="Bitstream Charter"
style:font-family-generic="roman"
style:font-pitch="variable"
fo:font-size="14pt"
fo:font-style="italic"/>
</style:style>
<!-- style for text summary of results -->
<style:style style:name="info" style:family="paragraph">
<style:paragraph-properties>
<style:tab-stops>
<style:tab-stop style:position="3.5cm"
style:type="right"/>
<style:tab-stop style:position="5cm"
style:type="char"
style:char="."/>
</style:tab-stops>
</style:paragraph-properties>
<style:text-properties
style:font-name="Bitstream Charter"
style:font-family-generic="roman"
style:font-pitch="variable"
fo:font-size="10pt"/>
</style:style>
<!-- style to force a move to column two -->
<style:style style:name="colBreak" style:family="paragraph">
<style:paragraph-properties fo:break-before="column"/>
</style:style>
<!-- set column widths -->
<style:style style:name="Sect1" style:family="section">
<style:section-properties
text:dont-balance-text-columns="true">
<style:columns fo:column-count="2">
<style:column style:rel-width="5669*"
fo:margin-left="0cm" fo:margin-right="0cm"/>
<style:column style:rel-width="5131*"
fo:margin-left="0cm" fo:margin-right="0cm"/>
</style:columns>
</style:section-properties>
</style:style>
<!-- style for chart frame -->
<style:style style:name="fr1" style:family="graphic">
<style:graphic-properties style:wrap="run-through"
style:vertical-pos="middle"
style:horizontal-pos="from-left"/>
</style:style>
</office:automatic-styles>
<office:body>
<office:text>
CONTENT_HEADER
| | Rather than create a table for the summary of the results, we took the easy way out and set up tab stops to align the data properly. |
| | We have two columns with text that is not automatically distributed to both columns. Because the columns have different relative widths, we do not have an fo:column-gap attribute in the <style:columns> element. |
That finishes the static portion of the content file. We now grab all the rows. Then, for each row in the table
- Find the total number of responses.
- Create a new section with the question text as the header.
- For each cell in the row, output the legend (Strongly agree, agree, etc.), the number of responses, and the percentage.
- Create a reference to the chart.
- Create a directory for the chart.
- Create the chart itself (handled in a subroutine).
- Add the path to the chart to the manifest file.
After processing all the rows, we close the remaining tags in the content.xml and manifest.xml files, and then close the files. Once all the files are created and added to the .zip file, we write the zip file and then unlink the temporary files. This finishes the main program.
$rows = $doc->getElementsByTagName( "table:table-row" );
getRowContents( \@legends, $rows->item(0));

$n_rows = $rows->getLength;

for ($row=1; $row<$n_rows; $row++)
{
    getRowContents( \@data, $rows->item($row));

    next if (!$data[0]);  # skip rows without a question

    $sum = 0;
    for ($col=1; $col < scalar(@data); $col++)
    {
        $sum += $data[$col];
    }

    print $main_handle qq!<text:section text:style-name="Sect1"!;
    print $main_handle qq! text:name="Section$row">!;
    print $main_handle qq!<text:h text:style-name="hdr1" text:outline-level="1">!;
    print $main_handle qq!$row. $data[0]</text:h>\n!;
    for ($col=1; $col < scalar(@data); $col++)
    {
        $percent = sprintf(" (%.2f%%)", 100*$data[$col]/$sum);
        print $main_handle qq!<text:p text:style-name="info">!;
        print $main_handle qq!$legends[$col]<text:tab/>$data[$col]!;
        print $main_handle qq!<text:tab/>$percent</text:p>\n!;
    }

    # now insert the reference to the graph

    print $main_handle qq!<text:p text:style-name="colBreak">!;
    print $main_handle qq!<draw:frame draw:style-name="fr1"
        draw:name="Object$row" draw:layer="layout"
        svg:width="8cm" svg:height="7cm"><draw:object
        xlink:href="./Object$row" xlink:type="simple"
        xlink:show="embed" xlink:actuate="onLoad"/></draw:frame>\n!;
    print $main_handle qq!</text:p>\n!;
    print $main_handle qq!</text:section>\n!;

    construct_chart( \@legends, \@data, $row );

    append_manifest( $row );
}


print $main_handle <<"CONTENT_FOOTER";
        </office:text>
    </office:body>
</office:document-content>
CONTENT_FOOTER

close $main_handle;

print $manifest_handle "</manifest:manifest>\n";
close $manifest_handle;
$zip->addFile( $manifest_filename, "META-INF/manifest.xml");
$zip->addFile( $main_filename, "content.xml");
$zip->writeToFileNamed( $ARGV[1] );

foreach $item (@temp_filename)
{
    unlink $item;
}
Let’s handle the easy subroutine first—adding the path information to the manifest file. The append_manifest subroutine takes one parameter: the chart number.
#
#   Append data to the manifest file;
#   the parameter is the chart number
#
sub append_manifest
{
    my $number = shift;

    print $manifest_handle <<"ADD_MANIFEST";
<manifest:file-entry
    manifest:media-type="application/vnd.oasis.opendocument.chart"
    manifest:full-path="Object$number/"/>
<manifest:file-entry
    manifest:media-type="text/xml"
    manifest:full-path="Object$number/content.xml"/>

ADD_MANIFEST
}
Finally, the subroutine to construct the chart. Again, we start with an immense amount of boilerplate, with styles for the chart title, legend, plot area, the data series, and the individual pie slices.
#
#   Construct the chart file, given:
#       reference to the @legends array
#       reference to the @data array
#       chart number
#
sub construct_chart
{
    my $legendref = shift;
    my $dataref = shift;
    my $chart_num = shift;

    my $cell;   # current cell number being processed

    ($chart_handle, $chart_filename) = Archive::Zip->tempFile();
    push @temp_filename, $chart_filename;
    print $chart_handle <<"CHART_HEADER";
<office:document-content
  xmlns:office="urn:oasis:names:tc:opendocument:xmlns:office:1.0"
  xmlns:style="urn:oasis:names:tc:opendocument:xmlns:style:1.0"
  xmlns:text="urn:oasis:names:tc:opendocument:xmlns:text:1.0"
  xmlns:table="urn:oasis:names:tc:opendocument:xmlns:table:1.0"
  xmlns:draw="urn:oasis:names:tc:opendocument:xmlns:drawing:1.0"
  xmlns:fo="urn:oasis:names:tc:opendocument:xmlns:xsl-fo-compatible:1.0"
  xmlns:xlink="http://www.w3.org/1999/xlink"
  xmlns:number="urn:oasis:names:tc:opendocument:xmlns:datastyle:1.0"
  xmlns:svg="urn:oasis:names:tc:opendocument:xmlns:svg-compatible:1.0"
  xmlns:chart="urn:oasis:names:tc:opendocument:xmlns:chart:1.0"
  office:version="1.0">
    <office:automatic-styles>
        <number:number-style style:name="N0">
            <number:number number:min-integer-digits="1"/>
        </number:number-style>
        <style:style style:name="main" style:family="chart">
            <style:graphic-properties draw:stroke="none"
                svg:stroke-width="0cm" svg:stroke-color="#000000"
                draw:fill-color="#ffffff"/>
        </style:style>
        <style:style style:name="title" style:family="chart">
            <style:text-properties
                style:font-family-generic="swiss"
                fo:font-size="12pt"/>
        </style:style>
        <style:style style:name="legend" style:family="chart">
            <style:text-properties
                style:font-family-generic="swiss"
                fo:font-size="8pt"/>
        </style:style>
        <style:style style:name="plot" style:family="chart">
            <style:chart-properties
                chart:lines="false"
                chart:series-source="columns"/>
        </style:style>
        <style:style style:name="axis" style:family="chart"
            style:data-style-name="N0">
            <style:chart-properties chart:display-label="true"/>
        </style:style>
        <style:style style:name="series" style:family="chart">
            <style:graphic-properties draw:fill-color="#ffffff"/>
        </style:style>

        <style:style style:name="slice1" style:family="chart">
            <style:graphic-properties draw:fill-color="#ff6060"/>
        </style:style>
        <style:style style:name="slice2" style:family="chart">
            <style:graphic-properties draw:fill-color="#ffa560"/>
        </style:style>
        <style:style style:name="slice3" style:family="chart">
            <style:graphic-properties draw:fill-color="#ffff60"/>
        </style:style>
        <style:style style:name="slice4" style:family="chart">
            <style:graphic-properties draw:fill-color="#60ff60"/>
        </style:style>
        <style:style style:name="slice5" style:family="chart">
            <style:graphic-properties draw:fill-color="#6060ff"/>
        </style:style>
        <style:style style:name="slice6" style:family="chart">
            <style:graphic-properties draw:fill-color="#606080"/>
        </style:style>
    </office:automatic-styles>
The “here” document continues with the static part of the <office:body>, setting up the chart, title, legend, plot area, and table headings. There is only one series of data per chart, and each series has six data points. The first row of the table is a dummy header row, with the letter N (number of responses) as its content.
<office:body>
  <office:chart>
    <chart:chart chart:class="chart:circle" chart:style-name="main"
      svg:width="9cm" svg:height="9cm">
    <chart:title chart:style-name="title" svg:x="1cm"
        svg:y="0.25cm">
        <text:p>${$dataref}[0]</text:p>
    </chart:title>
    <chart:legend chart:legend-position="end" svg:x="8cm" svg:y="3cm"
        chart:style-name="legend"/>

    <chart:plot-area svg:x="0.5cm" svg:y="1.5cm"
        svg:width="6cm" svg:height="6cm" chart:style-name="plot">
        <chart:axis chart:dimension="y" chart:style-name="axis"
            chart:name="primary-y">
            <chart:grid chart:class="major"/>
        </chart:axis>
        <chart:series chart:style-name="series"
            chart:values-cell-range-address="local-table.B2:.B7"
            chart:label-cell-address="local-table.B1">
            <chart:data-point chart:style-name="slice1"/>
            <chart:data-point chart:style-name="slice2"/>
            <chart:data-point chart:style-name="slice3"/>
            <chart:data-point chart:style-name="slice4"/>
            <chart:data-point chart:style-name="slice5"/>
            <chart:data-point chart:style-name="slice6"/>
        </chart:series>
    </chart:plot-area>
    <table:table table:name="local-table">
        <table:table-header-columns>
            <table:table-column/>
        </table:table-header-columns>
        <table:table-columns>
            <table:table-column table:number-columns-repeated="2"/>
        </table:table-columns>

        <table:table-header-rows>
            <table:table-row>
                <table:table-cell><text:p/></table:table-cell>
                <table:table-cell office:value-type="string">
                    <text:p>N</text:p>
                </table:table-cell>
            </table:table-row>
        </table:table-header-rows>
        <table:table-rows>
CHART_HEADER
Now we create the dynamic portion of the table contents; each category (Strongly Agree/Agree/etc.) is in the first column, and the number of responses in the second column. The subroutine finishes by closing off all the open tags.
    for ($cell=1; $cell < scalar(@{$dataref}); $cell++)
    {
        print $chart_handle qq!<table:table-row>\n!;
        print $chart_handle qq!<table:table-cell office:value-type="string">!;
        print $chart_handle qq!<text:p>!, ${$legendref}[$cell], qq!</text:p>!;
        print $chart_handle qq!</table:table-cell>!;
        print $chart_handle qq!<table:table-cell office:value-type="float" !;
        print $chart_handle qq!office:value="!, ${$dataref}[$cell], qq!">!;
        print $chart_handle qq!<text:p>!, ${$dataref}[$cell], qq!</text:p>!;
        print $chart_handle qq!</table:table-cell></table:table-row>\n!;
    }
    print $chart_handle <<"CHART_FOOTER";
</table:table-rows>
</table:table>
</chart:chart>
</office:chart>
</office:body>
</office:document-content>
CHART_FOOTER
    close $chart_handle;
    $zip->addFile( $chart_filename, "Object$row/content.xml" );
}
To make a three-dimensional chart, you must add the chart:three-dimensional attribute to the style that controls the <chart:plot-area>, and you must give it a value of true. If you want extra depth on the chart, you may set the chart:deep attribute to true as well. In a perfect world, that would be all that you would need to do. Unfortunately, if you leave it at that, your three-d bar charts will come out looking like Figure 8.7, “Insufficient Three-Dimensional Information”, which is not what you want.[14]
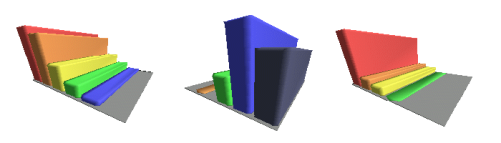
In order to get a reasonable-looking chart, you must add the following attributes to your <chart:plot-area> element. You can get by with just the first of these, <dr3d:distance>, but the results will still be significantly distorted.
- dr3d:distance, the distance from the camera to the object.
- dr3d:focal-length, the length of focus of the virtual camera.
- dr3d:projection, which may be either parallel or perspective.
You may also add any of the attributes that you would add to a <dr3d:scene> element, as described in the section called “The dr3d:scene element”. If you want to set the lighting, add <dr3d:light> elements as children of the <chart:plot-area> element. This element is described in the section called “Lighting”.
[13] This survey uses what is called a six-point Likert scale. If you are setting up a survey, always make sure you have an even number of choices. If you have an odd number of choices with “Neutral” in the middle, people will head for the center like moths to a flame. Using an even number of choices forces respondents to make a decision.
[14] As modern art, this is actually quite nice. The results for a pie chart are quite disturbing.