Traces
Adding traces
You can add one or more analog or digital traces to the selected plot in the current Probe window. To view information about the trace, including which section and/or file its data came from, right-click the trace in the Probe window and choose Information.
To add one or more traces to a plot
- On the toolbar, click the Add Trace button to display the Add Traces dialog box:
- Select the simulation output variable that you want to display by clicking one of the variables in the list. Click here Narrowing the list of output variables for information on narrowing this list.
-
Optional: Select operators, functions, or macros from the Functions or Macros list box to refine the data to be displayed. Depending on what you use, you may need to select more than one output variable.
- Click here Defining analog trace expressionsfor more information on using operators, functions, and macros for analog traces.
- Click here Defining digital trace expressions for more information on using operators, functions, and macros for digital traces.
- Click OK.
To modify a trace that is already displayed
- Double-click the trace name in the plot legend. In the Modify Traces dialog box, you can perform the same functions as in the Add Traces dialog box, but apply them to the selected trace.
Viewing trace information
You can view the trace name, the path for the data file from which the trace was generated (when you have more than one waveform data file loaded), information about the simulation that produced the waveform data file, and the number of data points used.
The Section Information dialog box appears, displaying information for the trace.
Editing trace display properties
When you create a trace and it is assigned a color by your scheme setting, the color stays even if you delete a trace; the colors are not reassigned. The same is true if you change the color of an individual trace. Color schemes are specified in the Probe Settings dialog box (from the Tools menu, choose Options).
Trace colors are reassigned when you apply a new scheme.
- Select and right-click a trace and choose Properties to display the Trace Properties dialog box. (You can also SHIFT+click to select multiple traces or use the Select All command from the Edit menu to select all the traces before right-clicking to change them all as a group.)
-
Set any of the following options:
- From the Color list, select a color to use for the trace.
- From the Pattern list, select a pattern to use for the trace.
- From the Width list, select a width to use for the trace.
- From the Symbol list, select a symbol to associate with the trace in the plot legend. Select Show Symbol to display the symbol on the trace itself.
- Click OK to apply the new settings and close the Trace Properties dialog box.
- If you do not see the changes immediately, from the View menu, choose Redraw to redraw the display.
Setting grid display properties
You can change the grid properties separately for the major and minor grids on the x- and y-axes.
- Right-click a gridline, then choose Properties to display a Grid Properties dialog box.
- Set any of the following options:
- Click OK to apply the new settings and close the Grid Properties dialog box.
Setting plot edge properties
To edit the plot edge properties
- Right-click a plot edge, then choose Properties to display a Plot Edge Properties dialog box.
- Set any of the following options:
- Click OK to apply the new settings and close the Plot Edge Properties dialog box.
Defining analog trace expressions
When defining analog trace expressions, you can include any combination of analog simulation output variables, arithmetic operators, functions, macros, and sweep variables.
For AC analysis, PSpice uses complex arithmetic to evaluate expressions and displays the magnitude of complex results. If the result is real (for example, IMG(V(4)+V(5))), then it can be negative. If the result is complex, (for example, V(4)+(5)), then the magnitude is displayed, which is always positive.
For procedures, see the following topics:
- To use a function or arithmetic operator
-
To use a sweep variableYou can add traces that use data from individual data files that you loaded into PSpice. Click here To use a function or arithmetic operator for an example.Device noise is available in addition to total input and output noise. These are generated only if you run a noise analysis. Click here Device noise variables to display the device noise output variables.
Analog Operators
Valid analog arithmetic operators:
Analog Functions
Valid analog arithmetic functions:
To use a function or arithmetic operator
- From the Functions or Macros list, select Analog Operators and Functions.
- In the corresponding list, click the operator symbol or function name you want to use.
- If the selection is a function, fill in the arguments list by doing the following:
-
V(Out1)@1
displays the (VOut1) data contained in the first section of available data. -
V(Out2)@f2
displays the V(Out2) data contained in the second file of a set of loaded data files. -
V(Out2)@”path_name”
displays the V(Out2) data contained in the specified .dat file, which must already be loaded. -
V(Out1)@1@f2
displays the V(Out1) data in the first section in the second file of a set of loaded data files.
Using analog output variables
-
From the Trace menu, choose Add Trace to display the Add Traces dialog box.
Enter names in the Trace Expression text box using the following notations.
is the (optional) name you want to use to represent this trace expression on the plot.
For example, V(3) or V(1,3).
For example, VC(Q5), IB(Q2), and VG(M2) are valid, but not V(R3) or VCE(Q13).- I(device_name) for current value through a device.
- VG(x) or IG(x) for group delay for voltage and current values, respectively.
- N<noise_type>(<device_name>) for the contribution from <noise_type> of <device_name> to the total output noise.
For example, NFID(M1) represents the flicker noise at MOSFET M1.
For noise values, use the variables as shown below:
Total Noise Variables
Device noise variables
Click here About noise units for more information on how noise units are reported.
How noise units are reported
|
total input or output noise of the forms V(ONOISE) or V(INOISE) |
Defining digital trace expressions
When defining digital trace expressions, you can include any combination of digital signals, buses, signal constants, bus constants, digital operators, and macros.
- An arithmetic or logical operation between two bus operands results in a bus value that is wide enough to contain the result.
- An arithmetic or logical operation between a bus operand and a signal operand results in a bus value.
For procedures, see the following topics:
To add a digital signal
-
Do one of the following:
or - If you want to name the signal with a name that is different from the node name:
Syntax
To specify the digital node name or expression to use in adding a digital signal, use the syntax:
<digital_node_name>;<display_name>
<digital_expression>;<display_name>
Example
specifies a digital trace using the node U2:Y, named OUT1 on the plot.
To add a bus
- From the Functions and Macros list, select Digital Operators and Functions.
- Click the { } entry.
- In the Simulation Output Variables list, click the digital signals in high order to low order sequence.
- If you want to name the bus with a name that is different from the default:
- If you want to set the radix to something other than the default:
Syntax
Specify the contained signals and name of the bus using the syntax:
{digital signals list};display name;radix
{bus_prefix[msb:lsb]};display name;radix
Examples
specifies a 3 bit bus whose high order bit is the digital value at node Q2. On a plot, PSpice names the bus signal A, and values appear in octal notation.
specifies a 4 bit bus. On a plot, values appear in decimal notation. Since no display name is specified, PSpice names the bus signal with the signal list.
radix
To add a digital signal or bus constant
- If needed, click in the Trace text box at the location where you want the constant.
- In the Digital Operators and Functions list box, click the signal constant value.
- Click in the Trace text box at the location where you want the constant.
- Type the bus expression using the syntax:
|
is the string of digits reflecting the constant value in the specified radix |
Examples
signal constants
bus constant radix
Valid bus constant radix values are all lower case as follows:
To use a digital operator
- From the Functions and Macros list, select Digital Operators and Functions.
- Click one of the digital operators in the corresponding list.
- If the operator is the grouping operator:
Digital operators
Valid digital arithmetic and boolean operators, listed in order of precedence:
To use a sweep variable
In the Add Trace dialog box, either select the sweep variable from the Simulation Output Variables list or type in the name as follows:
Narrowing the list of output variables
To restrict the simulation output variables
- In the Simulation Output Variables text box, type a wildcard string that approximates the output variables you want to see, then press Enter.
Examples
matches any output variable starting with C.
matches any two-character output variable starting with C.
Deleting traces
You can remove one or more analog or digital traces from a given plot in a Probe window.
To delete one or more traces from a plot
- Do one of the following to select the first trace that you want to delete:
- Shift-click other trace names to select more traces for removal.
- On the toolbar, click the Cut button to remove the trace or traces.
To delete all traces in the current plot
Setting the digital plot size
You can set the size of the digital plot to display on the screen to make more (or less) room for traces or trace names.
To set the digital plot size using the mouse
- Display at least one digital trace and one analog trace in the Probe window for which you want to set the digital size.
- To change the bottom position of the digital Probe window, do the following:
- To change the left side of the digital Probe window, do the following;
To set the digital plot size using menu options
- Display at least one digital trace in the plot for which you want to set the digital size.
- From the Plot menu, choose Digital Size.
- In the Digital Size dialog box, select the following:
- Click OK.
Using cursors
You can display the cursors on the plot, using two cursors per Probe window at a time. Each cursor displays the exact value of a single point on a curve. You can also change the number of digits displayed in the cursor box.
For more information, see the following topics:
To display both cursors
The dockable cursor window appears on the screen, showing the current position of the cursor on the x- and y-axes. Press and hold either the left or right mouse buttons to alternate moving one or the other cursor. As you move the cursors, the values in this cursor window change. Move the cursor box by dragging the box to another location.
To move the cursors using the mouse
To apply the cursors to a different trace
If you want to apply the cursors to a different trace, click the trace symbol in the plot legend for the trace you want to change to.
To freeze the cursor, do one of the following:
-
Choose Tools – Options.
The Probe Settings dialog box opens. - Select the Cursor Settings tab.
-
Select Show non-dockable(old) cursor window.
The Probe Cursor window appears. - Click the Probe Cursor window (below the title bar) to freeze the cursor locations on the current trace.
To change the number of digits displayed
- Choose Tools – Options.
- Select the Cursor Settings tab.
- In the Number of cursor digits text box, type a number between 2 and 18.
- Click OK.
To move the cursors using the keyboard
Use the following key combinations (directional keys on the keyboard) to move the cursors.
Moving cursors along a trace
You can move cursors to view the coordinates of any point on a trace.
Move a cursor by moving the mouse to the desired location and clicking the appropriate mouse button. The left mouse button controls the first cursor, and the right mouse button controls the second cursor. The move is made by the last cursor that was moved. For example, if you right-click the plot to move cursor 2 and then click the max button on the toolbar, cursor 2 will move to the maximum point on the trace it is positioned on.
There are also default keyboard shortcuts for moving cursors.
The trace each cursor follows is determined by the selected trace symbol. To change the trace on which the cursor is on, click a different trace symbol in the legend.
For more information, see the following topics:
- To turn cursors on or off
- To move the cursor to the next peak
- To move the cursor to the next trough
- To move the cursor to the next slope
- To move the cursor to a minimum or maximum point
- To move the cursor to the next data point generated by the simulator
- To move the cursor to the next transition
- To move the cursor to the previous transition
- To mark every data point with a symbol
- To search for a specific cursor location
To turn cursors on or off
To move the cursor to the next peak
-
On the toolbar, click the Cursor Peak button.
A first peak is a location where the points on each side of the peak have a lower Y value.
Peak is defined as the first local maxima (local peak) of the selected trace. If you click the Cursor Peak button again, cursor moves to the next local peak of the same trace in the forward direction. If you move the cursor in the reverse direction using mouse or arrow key, and then click the Cursor Peak button, cursor moves to the local peak in the that direction.
To move the cursor to the next trough
-
On the toolbar, click the Cursor Trough button.
A trough is the opposite of a peak. A first trough is a location where the points on each side of the trough have a higher Y value.
A trough is defined as the first local minima (local trough) of the selected trace. If you click Cursor Trough button again, it moves to the next local trough of the same trace in the forward direction. If you move the cursor in the reverse direction using mouse or arrow key, and then click the Cursor Trough button, cursor moves to the local trough in that direction.
To move the cursor to the next slope
-
On the toolbar, click the Cursor Slope button.
The slope is the change in Y over the change in X. The slope can be either positive or negative.
To move the cursor to a minimum or maximum point
-
To see the minimum value, on the toolbar, click the Cursor Min button.
The minimum value is the minimum Y value of the selected trace. -
To see the maximum value, on the toolbar, click the Cursor Max button.
The maximum value is the maximum Y value of the selected trace.
To move the cursor to the next data point generated by the simulator
-
On the toolbar, click the Cursor Point button.
Clicking this button takes the cursor to the next data point generated by the simulator.
To move the cursor to the next transition
-
On the toolbar, click the Cursor Next Tran button.
Clicking this button takes the cursor to the next transition point in a digital trace.
To move the cursor to the previous transition
-
On the toolbar, click the Cursor Prev Tran button.
Clicking this button takes the cursor to the previous transition point in a digital trace.
To mark every data point with a symbol
To search for a specific cursor location
- Choose Trace – Cursor – Display or click the Toggle Cursor button.
-
Choose Trace – Cursor – Search Commands or click the Cursor Search button.
The Search Command window opens. -
Specify the command
sfxv()orsfle()to move the cursor to specific X and Y locations respectively.
For example: -
Click OK.By default, the
sfxv()andsfle()commands search in the forward direction from current cursor location.
To move the cursor at a specific location in the reverse direction, use the following commands:
Changing views
You can change the way PSpice displays the traces on a plot. You can zoom in or out, change the center point, display only a selected area, see the previous view, and fit the display to the plot. You can also turn the display of the Toolbar and Status Bar on or off.
To zoom in or out
To change the center point
- From the View menu, choose Pan New Center.
-
Click the new center.
The screen redraws with the new center, maintaining the previous scale.
To display the selected area
- On the toolbar, click the Area button.
- Click the mouse in the display.
-
Drag a box around the area you want to view.
The area is displayed.
To redraw the screen
The screen is immediately redrawn.
To see the previous view
-
From the View menu, choose Previous.
The screen is redrawn to the previous view, whether it was the last scroll position or the last screen setting.
To go back to more views, repeat the command.
To fit the view
-
On the toolbar, click the Fit button.
The selected plot changes scale so that all data fits in the plot view on the screen.
To display the Toolbar
-
From the View menu, choose Toolbar.
A check mark next to the menu command indicates that the Toolbar is displayed.
To display the status bar
-
From the View menu, choose Status Bar.
A check mark next to the menu command indicates that the Status Bar is displayed.
To save or load a display
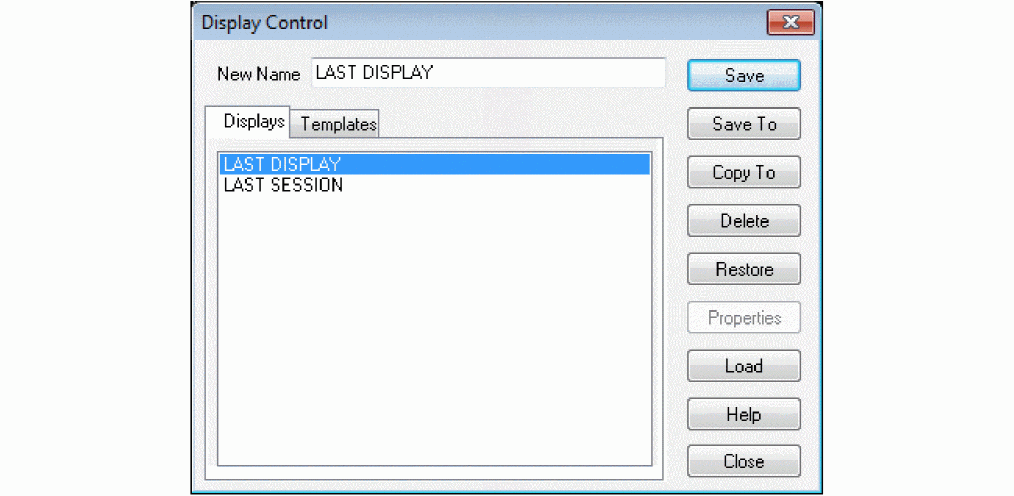
- From the Window menu, choose Display Control.
-
Do one of the following:
- To save the current display, type a name in the New Name box. Click Save.
- To save to a different location, click the Save To button. Type a new name. Click OK.
- To load a listed display, click the name and click the Restore button.
- To load a display not listed, click the Load button, then select the name of the .PRB file to load. Click OK. Click the name of the display to load, then click the Restore button.
- Click Close.
To use a saved display
-
From the Window menu, choose Display Control.
The Display Control dialog box appears.
- Click the Displays tab.
- Do one of the following:
- Click Restore.
To load displays from another .PRB file
-
From the Window menu, choose Display Control.
The Display Control dialog box appears. - Click the Displays tab.
- Click Load.
- Select the file.
- Click OK.
Creating a Fourier Transform
Fourier Transforms (FFT) can be applied to all the analog traces in a Probe window.
You can use Fourier Transforms to examine the spectrum of the output of non-linear circuits. The resolution of the transformed display is determined by the extent of the original x-axis. The extent of the transformed x-axis is determined by the number of original data points.
If you want the Fourier transform display in PSpice to show more resolution, run the transient analysis for a longer time interval. Run the circuit for many cycles if necessary.
When Fourier is used to end the Fourier transform mode, all traces are drawn normally and the x-axis variable goes back to its original domain.
- Select a plot to view.
-
On the toolbar, click the Fourier Transform button.
Fourier transforms of all traces are displayed.
Cautions when using FFTs
To correctly evaluate the harmonic components of a waveform, you must apply the Fourier Transform to a waveform with an integral number of periods. The FFT of a waveform with a partial period (e.g., 2.9 periods instead of 3) will generate false harmonic information.
To get an exact number of periods
In general, using several periods will give better results.
Changing axis settings
You can specify the way PSpice displays the x-axis or y-axis, or the x or y grids. The Axis Settings dialog box provides tabbed dialog boxes for defining the display characteristics for each of these options:
To set the x-axis
- Do one of the following to display the Axis Settings dialog box:
- Click the X Axis tab, and type or select the following:
- Click OK to apply the changes.
To set the y-axis
- Do one of the following to display the Axis Settings dialog box:
- Click the Y Axis tab, and type or select the following:
- Click OK to apply the changes.
To set the x-grid
- Do one of the following to display the Axis Settings dialog box:
- Click the X Grid tab, and type or select the following:
- Click OK to apply the changes.
To set the y-grid
- Do one of the following to display the Axis Settings dialog box:
- Click the Y Grid tab, and type or select the following:
- Click OK to apply the changes.
Using the ‘Save as Default’ and ‘Reset Defaults’ buttons
The Save as Default button provides a means of setting the default preferences that are used when traces are added or when new axes are created. This will not affect the settings of previously existing axes or traces.
The Reset Defaults button will restore the default settings to the original settings that are used when the program is first run.
To set the x-axis data range
- Double-click the x-axis to display the Axis Settings dialog box.
- Click the X Axis tab.
-
In the Data Range frame, choose either Auto Range or User Defined.
If you choose User Defined, specify the range in the text boxes. - In the Scale frame, do the following:
-
In the Use Data frame, choose either Full or Restricted.
If you choose Restricted, specify the range in the text boxes. - In the Processing Options frame, choose Fourier, Performance Analysis., or neither.
- Click Axis Variable to select the variable for the x-axis.
- Click the variable or trace you want as the variable for the x-axis. To see other available variables or traces, click the choices. Click here Defining analog trace expressions for more information on defining traces.
- Click OK.
To set the y-axis data range
- Do one of the following:
- Click Y Axis tab.
-
In the Data Range frame, choose either Auto Range or User Defined.
If you choose User Defined, specify the range in the text boxes. - In the Scale frame, do the following:
- In the Y Axis Number box, select an identification number for the y-axis.
- In the Axis Title box, type a title for the y-axis.
- Click OK.
Adding a new Y axis
You can add a new y-axis to the active Probe window. You can add up to 3 y-axes. The added y-axis becomes the selected y-axis. All subsequent traces added are added to the selected y-axis.
Deleting a Y axis
You can delete a y-axis you no longer want.
Using multiple plots
You can display multiple plots at the same time in one Probe window. When several plots are in the same Probe window, you can select one, delete one, or work with them as synchronized or unsynchronized. You can also copy and paste traces among plots.
Plots from the same set of waveform data are automatically synchronized. You can use unsynchronized plots to independently apply different scales, Fourier or Performance Analysis, or evaluate measurement expressions.
Unsynchronizing plots releases the selected plot to have its own x-axis. Plots that share x-axes are always displayed together, one above the other.
For more information, see the following topics:
To add a new plot
- Click in the Probe window to which you want to add the plot.
-
From the Plot menu, choose Add Plot to Window.
The new plot appears above the selected plot in the Probe window.
Now you can add traces.
To select the current plot
To delete a plot
To unsynchronize plots
If the selected plot is the middle plot of three plots sharing an X axis, then the middle plot is moved to the top position.
Using Probe windows
When you open a waveform data file, a new Probe window appears.
You can have more than one Probe window at a time. Each Probe window can contain one or more plots. Each plot can contain both analog and digital traces. You can copy and paste traces among plots.
You can create, select, arrange, and delete Probe windows by using the Plot and Windows menus. The title for the Probe window is a list of the waveform data files open for that window.
Probe windows feature automatic grid spacing. As you resize a Probe window, the major grid spacing changes, and the grid numbering appears as the numerals fit on the screen.
You can save the contents of a Probe window by using Display Control. Display control saves the plot configuration, including number of plots, traces and labels in each plot, x- and y-axis settings, and x-axis variable.
You can print any or all of the plots in a Probe window.
Toggling between display modes
You have the choice of using two different display modes.
The standard (default) display mode in PSpice includes the main Probe window, plus the output window and the simulation status window. This provides all possible information about the simulation run and contains all of the toolbars and settings.
The alternate display mode shows only the Probe window with any waveforms that have been plotted. This mode gives you just the plots you are interested in seeing without the additional simulation data normally provided by PSpice.
The toolbar and window settings are saved for each mode. Any changes you make in the settings will become the new default the next time you choose that display mode.
The alternate display mode can be very handy when you want to see the waveforms superimposed on the schematic diagram for easy debugging and testing of the circuit. You can customize the alternate display mode to view various toolbars or other PSpice windows, according to your own preferences.
To toggle between the standard and the alternate display modes:
Keeping the Probe window visible at all times
Like any other application running under Windows, the PSpice window will remain in the forefront of the desktop only as long as it is the active window. In order to keep the PSpice window visible at all times, you can use the push pin feature.
By keeping the Probe window on top of other active windows, you can easily view the schematic page at the same time you see the corresponding waveform for that circuit. This allows you to cross-probe quickly and easily without having to activate the Probe window each time.
To make the Probe window visible at all times:
To print plots
- To print one copy of the current Probe window using the default print settings, click the Printer button on the toolbar.
- Select the plots you want to print.
- If needed, select a printer and printer information.
- Click OK.
Using Display Control
You can create displays to save the contents of a Probe window. You can view a display again at a later time with a different simulation so long as the new simulation has identically named variables.
Once the display is saved, you can copy it, edit it, and delete it.

For more information, see the following topics:
To save a display
- Set up the plots, traces, labels, and axes in the Probe window you want to save.
-
From the Window menu, choose Display Control.
The Display Control dialog box appears. - Click the Displays tab.
- In the New Name text box, type a name for the display.
- Do one of the following:
- Click Close.
To copy a display
-
From the Window menu, choose Display Control.
The Display Control dialog box appears. - Click the Displays tab.
- Click the name of the display to copy.
- Click Copy To.
- Specify the name and location of the copied display.
- Click OK.
- Click Close.
To delete a display
-
From the Window menu, choose Display Control.
The Display Control dialog box appears. - Click the Displays tab.
- Do one of the following:
- Click Close.
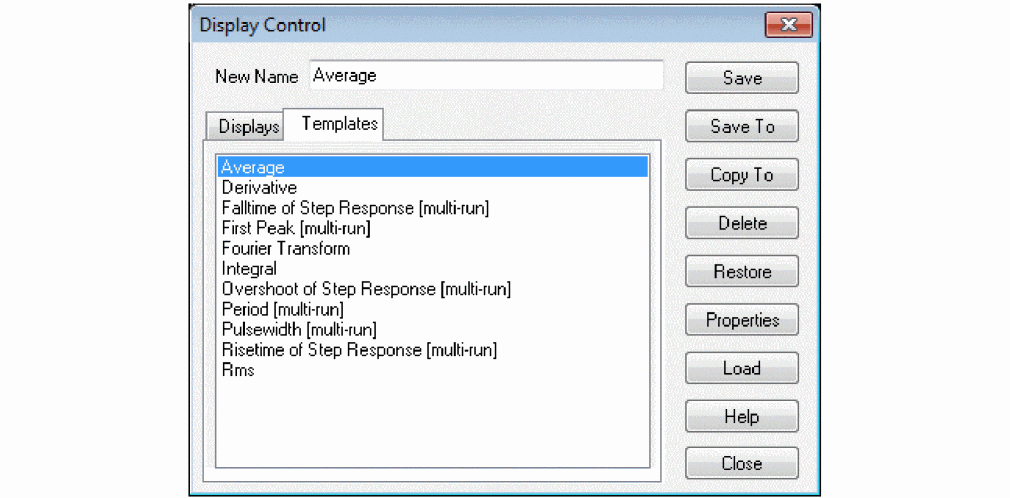
Using plot window templates
PSpice provides plot window templates that allow you to create and reuse custom displays in Probe using defined arguments. A plot window template is a plot window consisting of one or more arguments used to represent node voltage, pin current, power or digital names within a display. An argument provides the means to replace a fixed node voltage or pin current name with a node voltage or pin current name you choose.
You can create unique plot window templates for a particular design or general templates that can be applied to various designs. A set of some of the more commonly used templates are predefined and included with PSpice.
To work with plot window templates, from the Window menu, choose Display Control, and click the Templates tab. Here you can customize plot window templates in various ways. See the Related Topics below for more detailed information.
Related Topics
Creating a plot window template
In order to create and save a new plot window template, you must first set up the active plot window in Probe with the configuration you want. The active plot window will be the basis for the template properties you save.
To create a new plot window template
- In PSpice, from the Window menu, choose Display Control.
-
Click the Templates tab.
- In the New Name text box, enter the name for the new template you want to create.
-
Click Save or Save To.
The Save Plot Window Template – Step 1 of 2 dialog box appears.
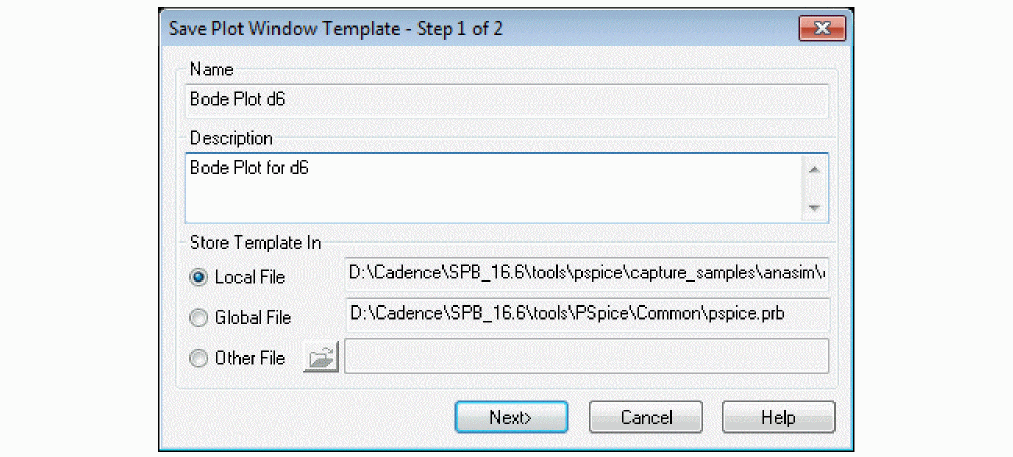
- In the Description text box, type in a description for the template, if you would like one. (This is optional.)
- If you clicked Save To instead of Save, choose the .PRB file you wish to save the template to by selecting the appropriate radio button under the Store Template In frame. (The default is the local .PRB file. For the Save function, the Local File is the only option.)
-
Click Next.
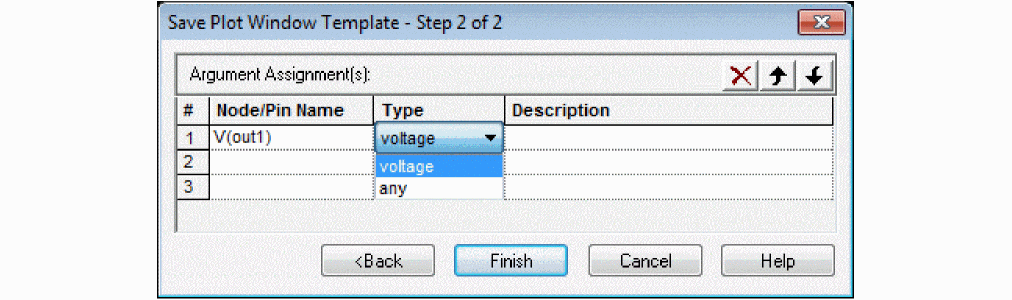
The Save Plot Window Template – Step 2 of 2 dialog box appears. The number of Node/Pin Name arguments that are listed here is determined by the current display.
-
Define the association of each argument by selecting the node or pin name from the drop-down list under the column Node/Pin Name.
This drop-down list shows all of the available node voltage, pin current, power or digital names. If the drop-down list does not appear, click in the text box to activate the drop-down button. -
For each argument, set the Type of argument to be used by selecting the argument name from the drop-down list under the column Type.
This drop-down list shows all of the available argument types (any, current, power, voltage). If the drop-down list does not appear, click in the text box to activate the drop-down button. -
For each argument, under the Description column, type in a description, if you would like one. (This is optional.)
The description you enter here will be displayed in the status line of Capture when placing a marker associated with the argument. - If desired, change the order of the arguments by using the Arrow buttons to move an argument up or down in the listing. Or, you can delete an argument by selecting it and clicking the Delete button.
- Click Finish.
Modifying a plot window template
Modifying a plot window template is essentially the same as creating a new template. In order to modify a plot window template, that particular template must be the active plot window in Probe. If the active display is not the template you want to modify, use the Restore button to make a different template the active display in Probe (see Restoring a plot window template).
To modify a plot window template
- From the Window menu, choose Display Control.
- Click the Templates tab.
- Select the template you want to modify by clicking on its name in the list of loaded templates. If the template you are looking for is not in the list, use the Restore button to make it the active display.
- Click Save to display the Save Plot Window Template – Step 1 of 2 dialog box.
- Make the desired changes, then click Next to display the Save Plot Window Template – Step 2 of 2 dialog box.
-
Make the desired changes, then click Finish.
The modifications will be saved and the display will be updated automatically.
Deleting a plot window template
You can remove a plot window template from the list of loaded templates. By deleting a plot window template, you remove it from the list of templates you can access and erase it from the .PRB file.
To delete a plot window template
- From the Window menu, choose Display Control.
- Click the Templates tab.
- Click the name of the plot window template you want to delete.
- Click Delete.
Copying a plot window template
You can copy a plot window template into another .PRB file to make it available for use later with that file.
To copy a plot window template
- From the Window menu, choose Display Control.
- Click the Templates tab.
- Click the name of the plot window template you want to copy.
-
Click Copy To.
The Probe File for Save Template dialog box appears. - Choose the .PRB file you wish to save the template to by selecting the appropriate radio button under the Store Template In frame. (The default is the local .PRB file.)
- Click OK.
Restoring a plot window template
In order to make a plot window template the active display in Probe, you must restore it. This process recalls a previously defined plot window template and sets up a new plot window in Probe using the arguments associated with that template. In order for the arguments in the template to apply, you must replace the node voltage names or pin current names for each argument contained in the restored template.
To restore a plot window template
- From the Window menu, choose Display Control.
- Click the Templates tab.
- Choose the plot window template you want to restore by clicking on its name in the list of loaded templates.
-
Click Restore.
The Restore Plot Window Template dialog box appears.

- Reassign the node voltage names or pin current names for each argument in the list.
-
Click OK.
A new Probe window will be created and the restored plot window template will be displayed.
Viewing the properties of a plot window template
You can view the properties of a plot window template and change the description fields for the template or arguments it contains.
To view the properties of a plot window template
- From the Window menu, choose Display Control.
- Click the Templates tab.
- Click the name of the plot window template you want to view.
-
Click Properties.
The Plot Window Template Properties dialog box appears.
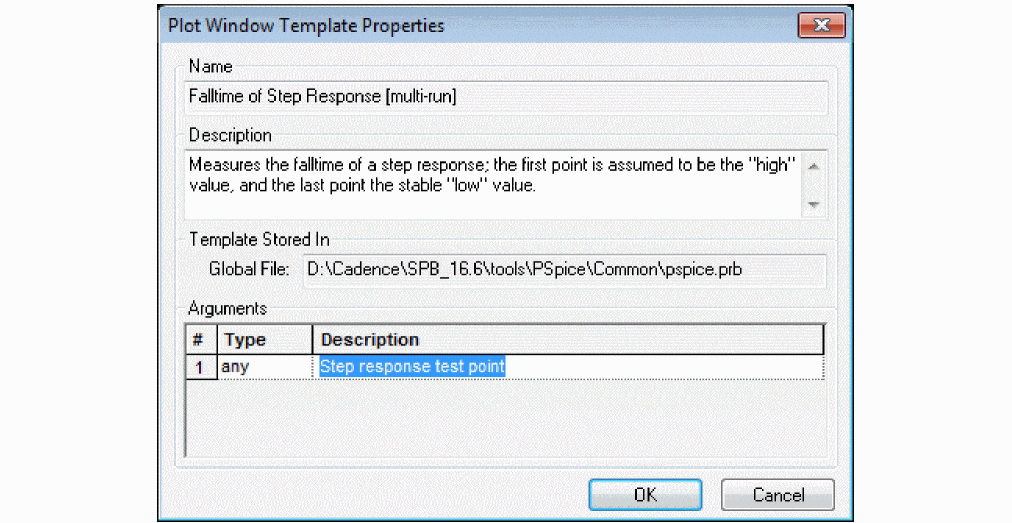
- Change the Description field for the template, or change the description for any of the Arguments, as desired.
- Click Finish to exit and save any changes.
Loading a plot window template
You can load a plot window template from another .PRB file, and add it to the list of available templates. When you load a template, you do not make it the active display in Probe. You are only adding it to the list of available templates. (To restore the display of a newly loaded template, see Restoring a plot window template.)
If a duplicate template is loaded, then the one you are loading will replace the current one in the list. If you close the data file and reopen it, any plot window templates that you loaded earlier will have to be loaded again to make them available. (Loaded templates are not saved with the data file.)
To load a plot window template
- From the Window menu, choose Display Control.
- Click the Templates tab.
-
Click Load.
The Load Displays dialog box appears. - Locate the .PRB file that contains the plot window template you want to load.
-
Select the file and then choose Open.
The loaded templates will be listed in the Display Control dialog box.
Placing plot window template markers
You can place a marker in Capture that represents a plot window template. The marker will restore the associated template when you run the simulation in PSpice. Markers for plot window templates are distinguished from other markers (for voltage, current, or power) by being square rather than round in shape.
A simulation profile must be active in order to place a marker for a plot window template. The analysis type defined in the profile will determine what type of template will be loaded (either for AC, DC or transient analysis). Plot window templates are defined for one analysis type only. For example, an AC simulation will show frequency domain templates such as Bode plot, while a transient analysis will show time domain templates such as risetime or pulsewidth. In addition, some predefined templates require multirun analyses (Monte Carlo analysis, time sweep, or parametric sweep).
When placing a plot window template marker, the argument description for the template being placed will appear in the status bar of Capture. Markers will continue to be placed until all arguments for the template have been satisfied. If an active simulation exists, then the template markers will turn black; otherwise, they will remain gray.
If an argument type is set to "Any" rather than a specific type, the marker type will depend on the marker placement location. If a marker is placed on a pin, then it will be assumed to be a current marker. If a marker is placed on a node, it will be assumed to be a voltage marker. If a marker is placed on a device, it will be assumed to be a power marker.
To place a plot window template marker
-
In Capture, from the PSpice menu, choose Markers, then select Plot Window Templates.
The Plot Window Templates dialog box appears.
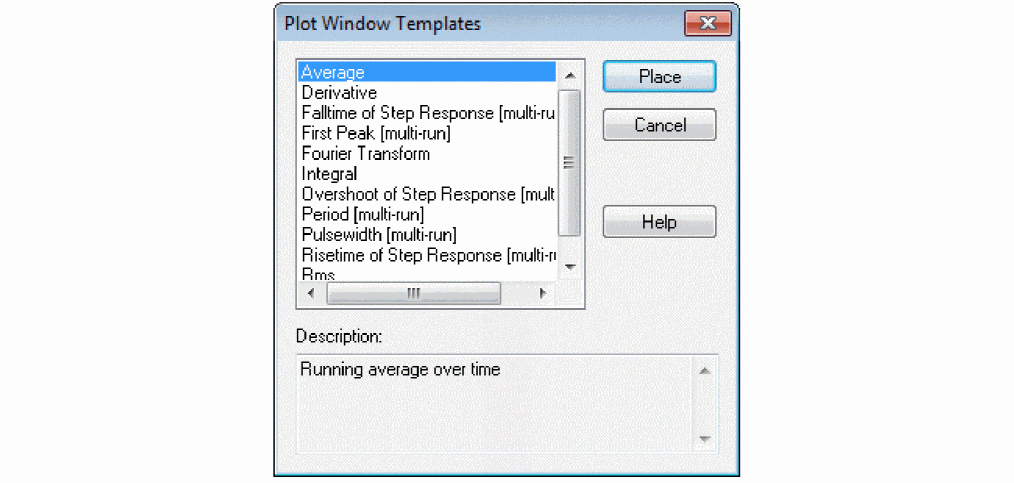
- Click the template you want to associate with the marker you will place.
-
Click Place.
A plot window template marker will appear and be attached to the cursor. - Place the marker at a particular location on the schematic page.
- Continue to place markers at the appropriate locations until all the arguments for the template have been satisfied.
Related Topics
Labeling plots
You can place labels to annotate an analog plot. Labels can be placed anywhere on the trace window, including outside the current Probe window where they are not visible. Unless you specifically set the plot region, PSpice rescales the plot so that all labels are visible.
You can place the following labels. Click one to display a procedure of how to use it.
To move a label
- Click to select a label. Shift+click to select several labels.
- Drag the labels to a new location, holding the mouse button down on the edge of one of the labels.
- Release the mouse button to place the labels.
To delete a label
To place text
- On the toolbar, click the Text button.
- In the Text Label dialog box, type a label in the text box. You can use up to 124 characters, including spaces.
- Click OK.
- Move the cursor to where you want to place the text.
- Click to place the text.
To draw a line
- From the Plot menu, point to Label, then choose Line.
- Click the start point for the line.
- Move the pointer to the end point for the line.
- Click to set the end point and draw the line.
To draw a poly-line
- From the Plot menu, point to Label, then choose Poly-line.
- Click the start point for the line.
- Move the pointer to the end point for the first segment.
- Click to set the end point and draw the first segment.
- Repeat steps 3 and 4 for the other segments.
- Right-click to complete the poly-line label.
To draw an arrow
- From the Plot menu, point to Label, then choose Arrow.
- Click the start point for the arrow. The arrowhead appears on the other end.
- Move the pointer to the end point for the line.
- Click to set the end point and draw the arrow.
To draw a box
- From the Plot menu, point to Label, then choose Box.
- Click to set the first corner of the box.
- Move the pointer to the other corner of the box.
- Click to set the corner and draw the box.
To draw a circle
- From the Plot menu, point to Label, then choose Circle.
- Click to set the center of the circle.
- Move the pointer to the outside point of the circle.
- Click to set the radius and draw the circle.
To draw an ellipse
- From the Plot menu, point to Label, then choose Ellipse.
- Type the inclination angle and click OK.
- Click to place the center of the ellipse.
- Move the pointer to size and shape the ellipse.
- Click to draw the ellipse.
To mark the cursor location
The Mark command places a cursor mark at the position of the most recently moved cursor.
A cursor mark consists of a text label with the coordinates of the cursor placed above and to the right of the cursor and a line label with one end anchored to the trace at the cursor and the other end placed just below the text.
If the line label is moved, the end anchored to the trace does not move, and the line stretches and rotates about the anchor point.
Editing labels
There are several ways to edit items in PSpice:
- You can copy the current Probe window to the Windows clipboard to be pasted in another Windows application.
- Other items can be cut and pasted.
- Objects like a single trace expression, a single text label, or a single ellipse label can be edited; edit traces by changing the expression that describes the trace.
- The text of text labels or inclination angle of ellipse labels can also be edited. For example, you can change the title of the currently active Probe window.
For more information, see the following topics:
To copy a Probe window to the clipboard
- Click the tab of the Probe window you want to copy.
- From the Window menu, choose Copy to Clipboard. The status line and the menu bar are not copied.
- Paste the bitmap into a graphics program like Microsoft Paint.
- Edit the bitmap as needed.
- Do one of the following:
To copy and paste an item
- Click an item.
- On the toolbar, click the Copy button.
- On the toolbar, click the Paste button.
- Click to place the item.
To modify a trace
To modify a label or an ellipse angle
- Click a label or an ellipse.
- From the Edit menu, choose Modify Object.
- Make any changes in the dialog box.
- Click OK.
Copying Probe data to other applications
Copying Probe window to the Windows Clipboard and word processing applications
To copy a Probe window to the Windows Clipboard and word processing applications like Microsoft Word, do the following:
- Click the tab of the Probe window you want to copy.
- From the Window menu, choose Copy to Clipboard. The Copy to Clipboard dialog box appears.
- Select the Make window and plot backgrounds transparent check box if you want to copy the probe window and plot background with a transparent background.
- Select the appropriate check box for the foreground color.
-
Click OK.
The Probe window is copied to the Windows Clipboard. The status line and the menu bar are not copied. - Paste the bitmap into a graphics program like Microsoft Paint.
- Edit the bitmap as needed.
- Do one of the following:
Copying Probe data to spreadsheet applications and math programs
You can copy the X and Y-axis data for traces on the Probe window to text editors, spreadsheet applications and math programs. You can then manipulate the data for your own purposes. For example, you can define custom measurement functions in Microsoft Excel and analyze the Probe data using those functions. You can also use the probe data in spreadsheet applications to create charts or graphs for presentation purposes.
- Click the tab of the Probe window from which you want to copy the data.
- Click the trace name in the plot legend. To select more than one trace name, use SHIFT+click or CTRL+click.
- From the Edit menu choose Copy.
-
Do one of the following:
- Paste the data into a spreadsheet or math program.
- Paste the data into a text editor and save it to an ASCII text file. The data is stored in a tab-delimited format.
Use this option if you want to import the data into other applications.
Loading large data file
To load a large data file, you can select one of the following methods:
Displaying fewer data points
Instead of using all the data points in the .dat file, only a few points are used to construct the complete trace. The number of data points used to construct the complete trace depends on the number of data points per trace defined in PSpice. By default, this limit is set to 1 million points, but if required, users can increase this limit. See Setting large data file options
Displaying partial trace
The complete trace is divided into multiple smaller parts. Only a part of the trace is loaded and displayed. Number of partial traces created depends on total number of data points used to define the trace and also on the number of data points per trace allowed in PSpice. By default, the number of data points per trace is set to 1 million points, but if required, users can increase this limit. See Setting options for large data files.
Importing traces
PSpice now allows you to import the traces stored in tabular format in a text (.txt) or comma-separated (.csv) file. Using the import feature you can import waveforms generated by measuring instruments such as digital oscilloscope to PSpice.
To import a trace into PSpice, saved in a text (.txt) or a comma-separated (.csv) file complete the following steps.
- From the File menu, choose Import.
-
In the Import File dialog box, select the text file to be imported in PSpice.
The Import Traces dialog box appears. All the nodes listed in the source file are listed in the X-axis drop-down list and the Available Nodes list. - In the Import Traces dialog box, specify the name and the location of the .DAT file in which the imported trace is to be stored.
- From the X-Axis drop-down list box, select the node name to be plotted on the X-Axis.
- Specify a name for the X-axis. Select one of the following options for naming the X-axis.
- From the Available Traces list box, select the traces that are to be imported in PSpice.
-
Click Add.
The selected traces appear in the Import Trace list box. To import all the traces available in the source file, click the Add All. - Select OK to import the selected trace(s).
Import Traces
This dialog box appears when you try to import a traces saved in the text format or in a .csv file.
Return to top